How Claude Code understands the physical mapping in the Greenhouse | March 21, 2026
Ireland imports around 83% of its fresh vegetables (Mick Kelly, The Irish Times). Commercial growers (including gas-heated greenhouse operations here in Ireland) do serious work trying to reduce import reliance at scale. But while there's an exponential sale of greenhouses, data on what an individual can realistically grow in a small, unheated urban greenhouse in Zone 8b Irish conditions are limited, to my knowledge. In this rather long essay, I detail my data driven experiment - where all started, how's going and what's next.
Audience: Residential Greenhouse owners, AI and Weather professionals, Companies adopting IoT or AI Solutions.
Where It All Started (My personal journey)
A few years ago, after stepping back from the tech world, I became something of a constant gardener - in the John le Carré sense.
I was mindful of buying veg imported from thousands of miles away. I shopped at local markets, avoided plastic packaging (even if plastic genuinely does extend shelf life), and immersed myself in the GIY (Grow It Yourself) movement. Early influences shaped my learnings: I discovered Charles Dowding’s No Dig methodologies, later found the high-density ecosystem management of Canada’s The Market Gardener (Jean-Martin Fortier), and followed closely farms like Green Earth Organics in Galway (Jenny & Kenneth Keavey), who advocate for sustainable and organic produce. To be fair, I was still buying 49c lemons at the supermarket (price elasticity and consumer behaviour is an article for another day).
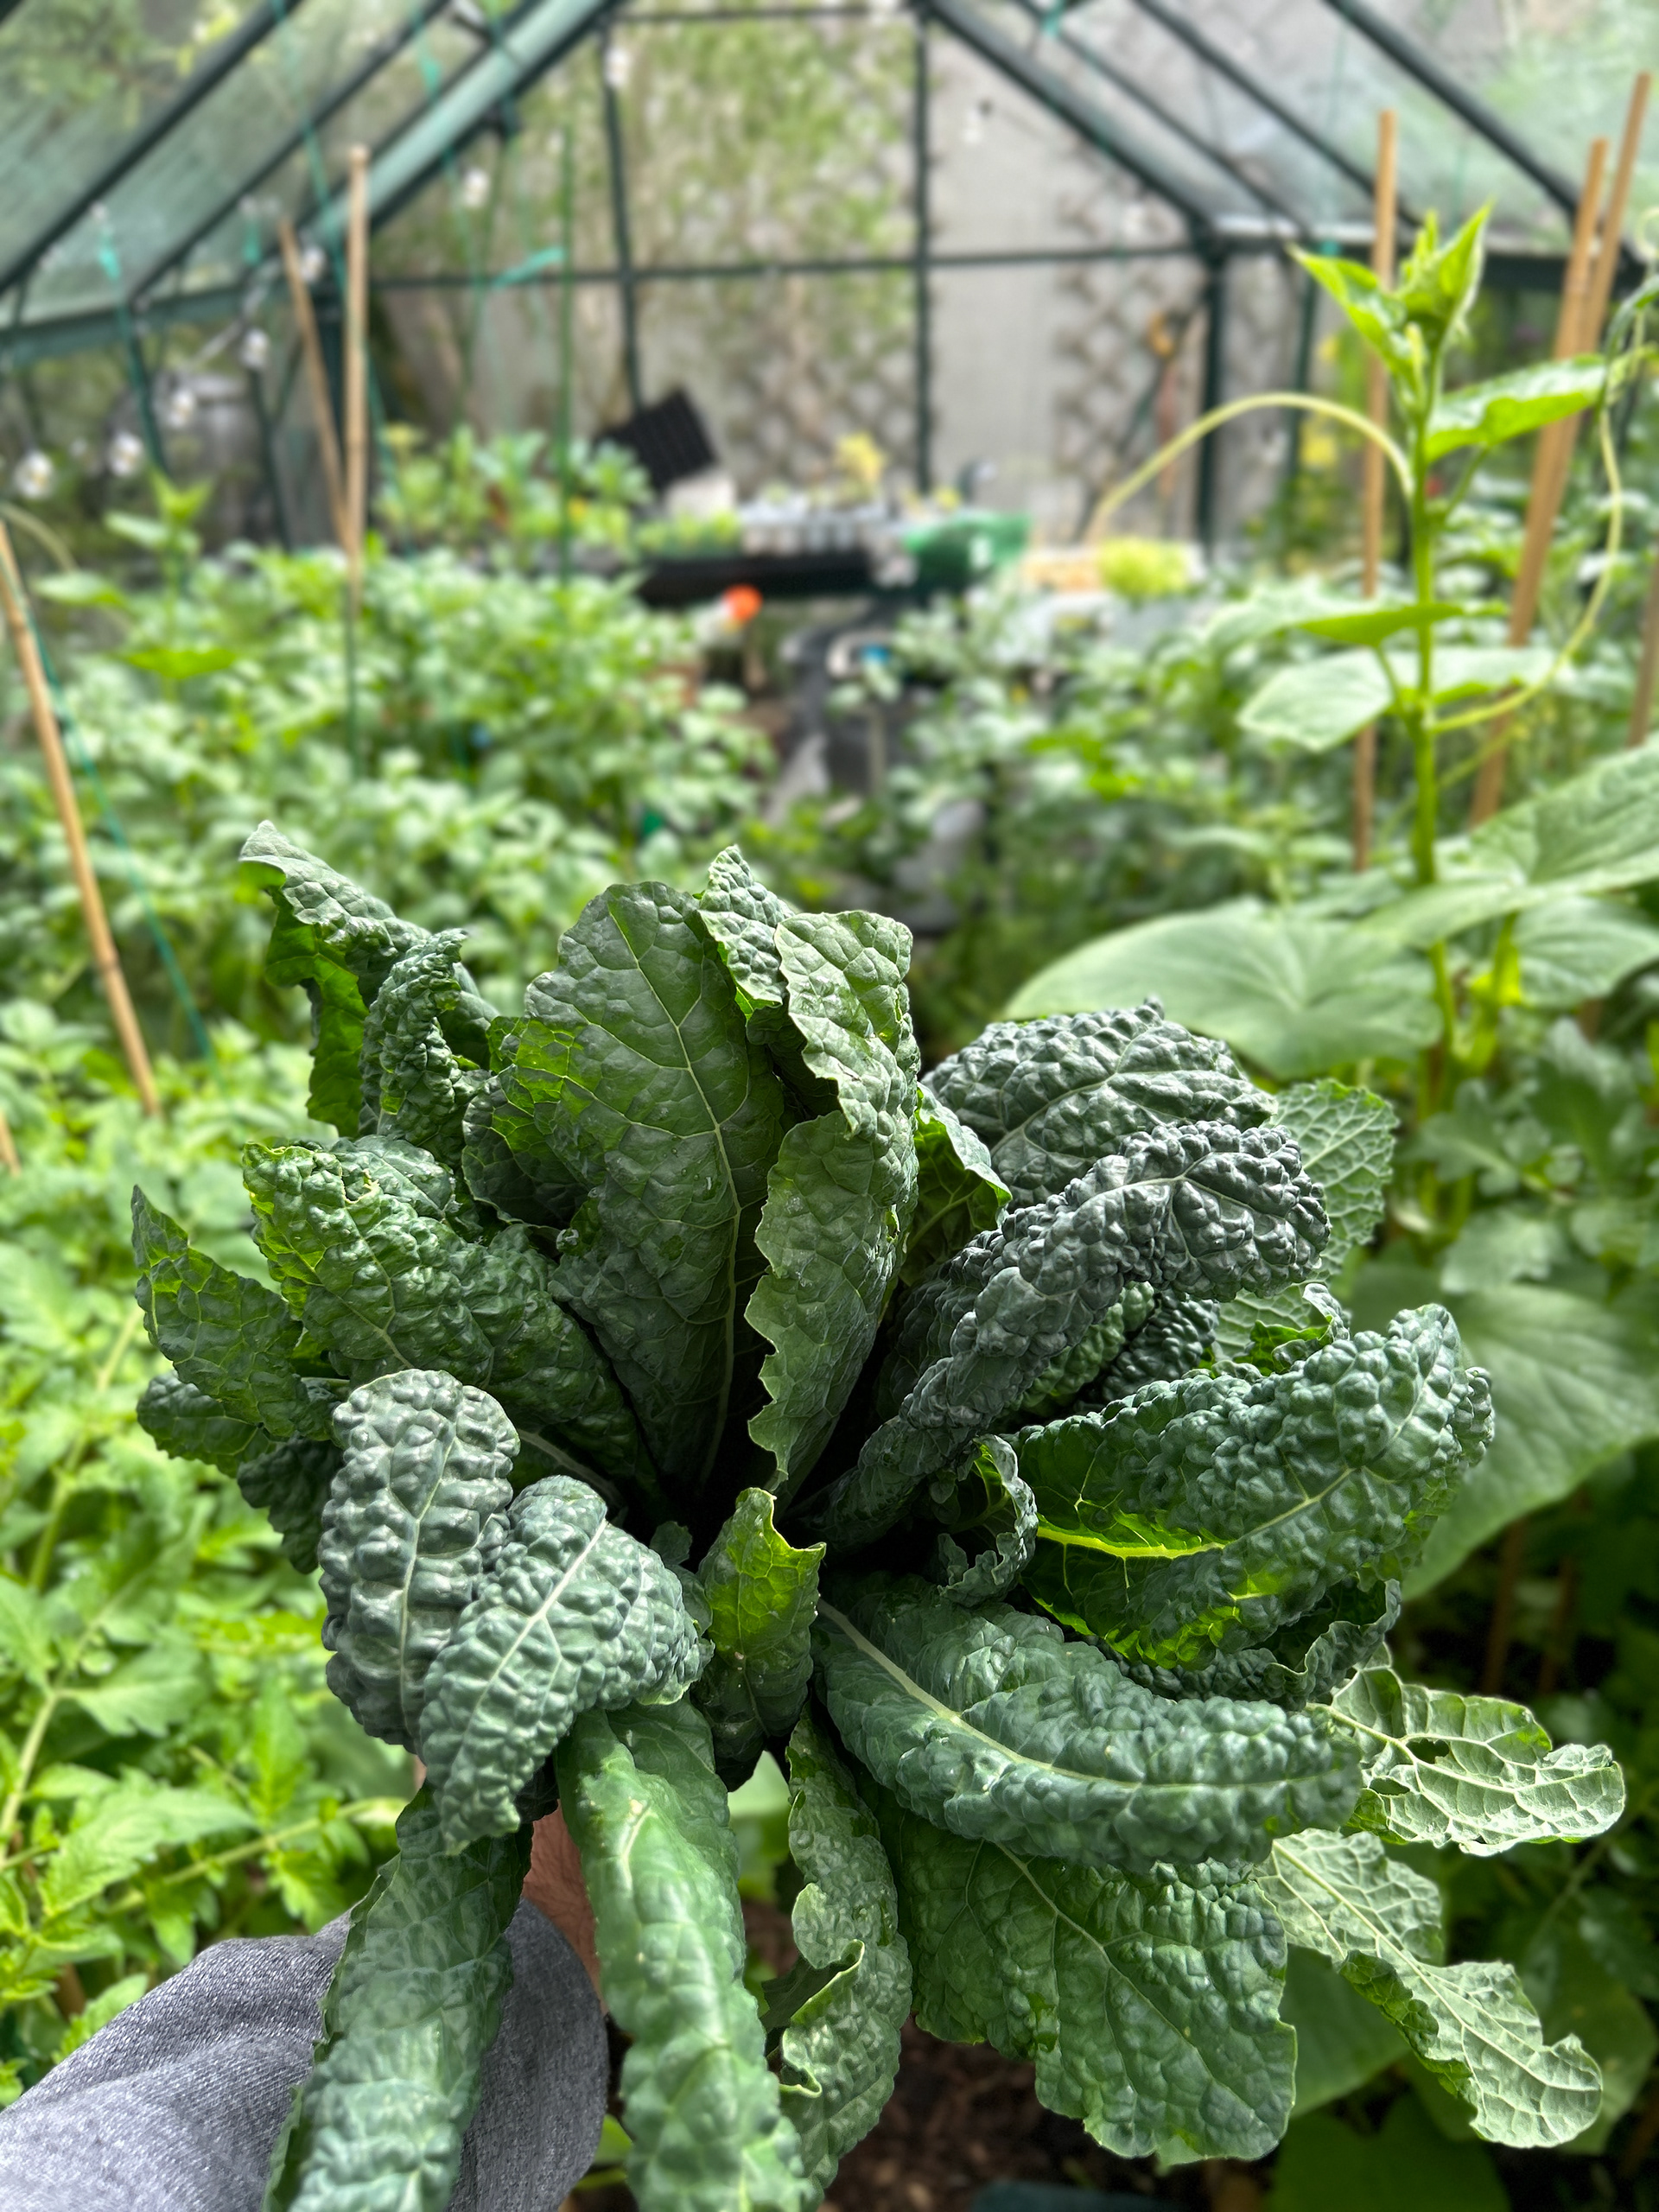
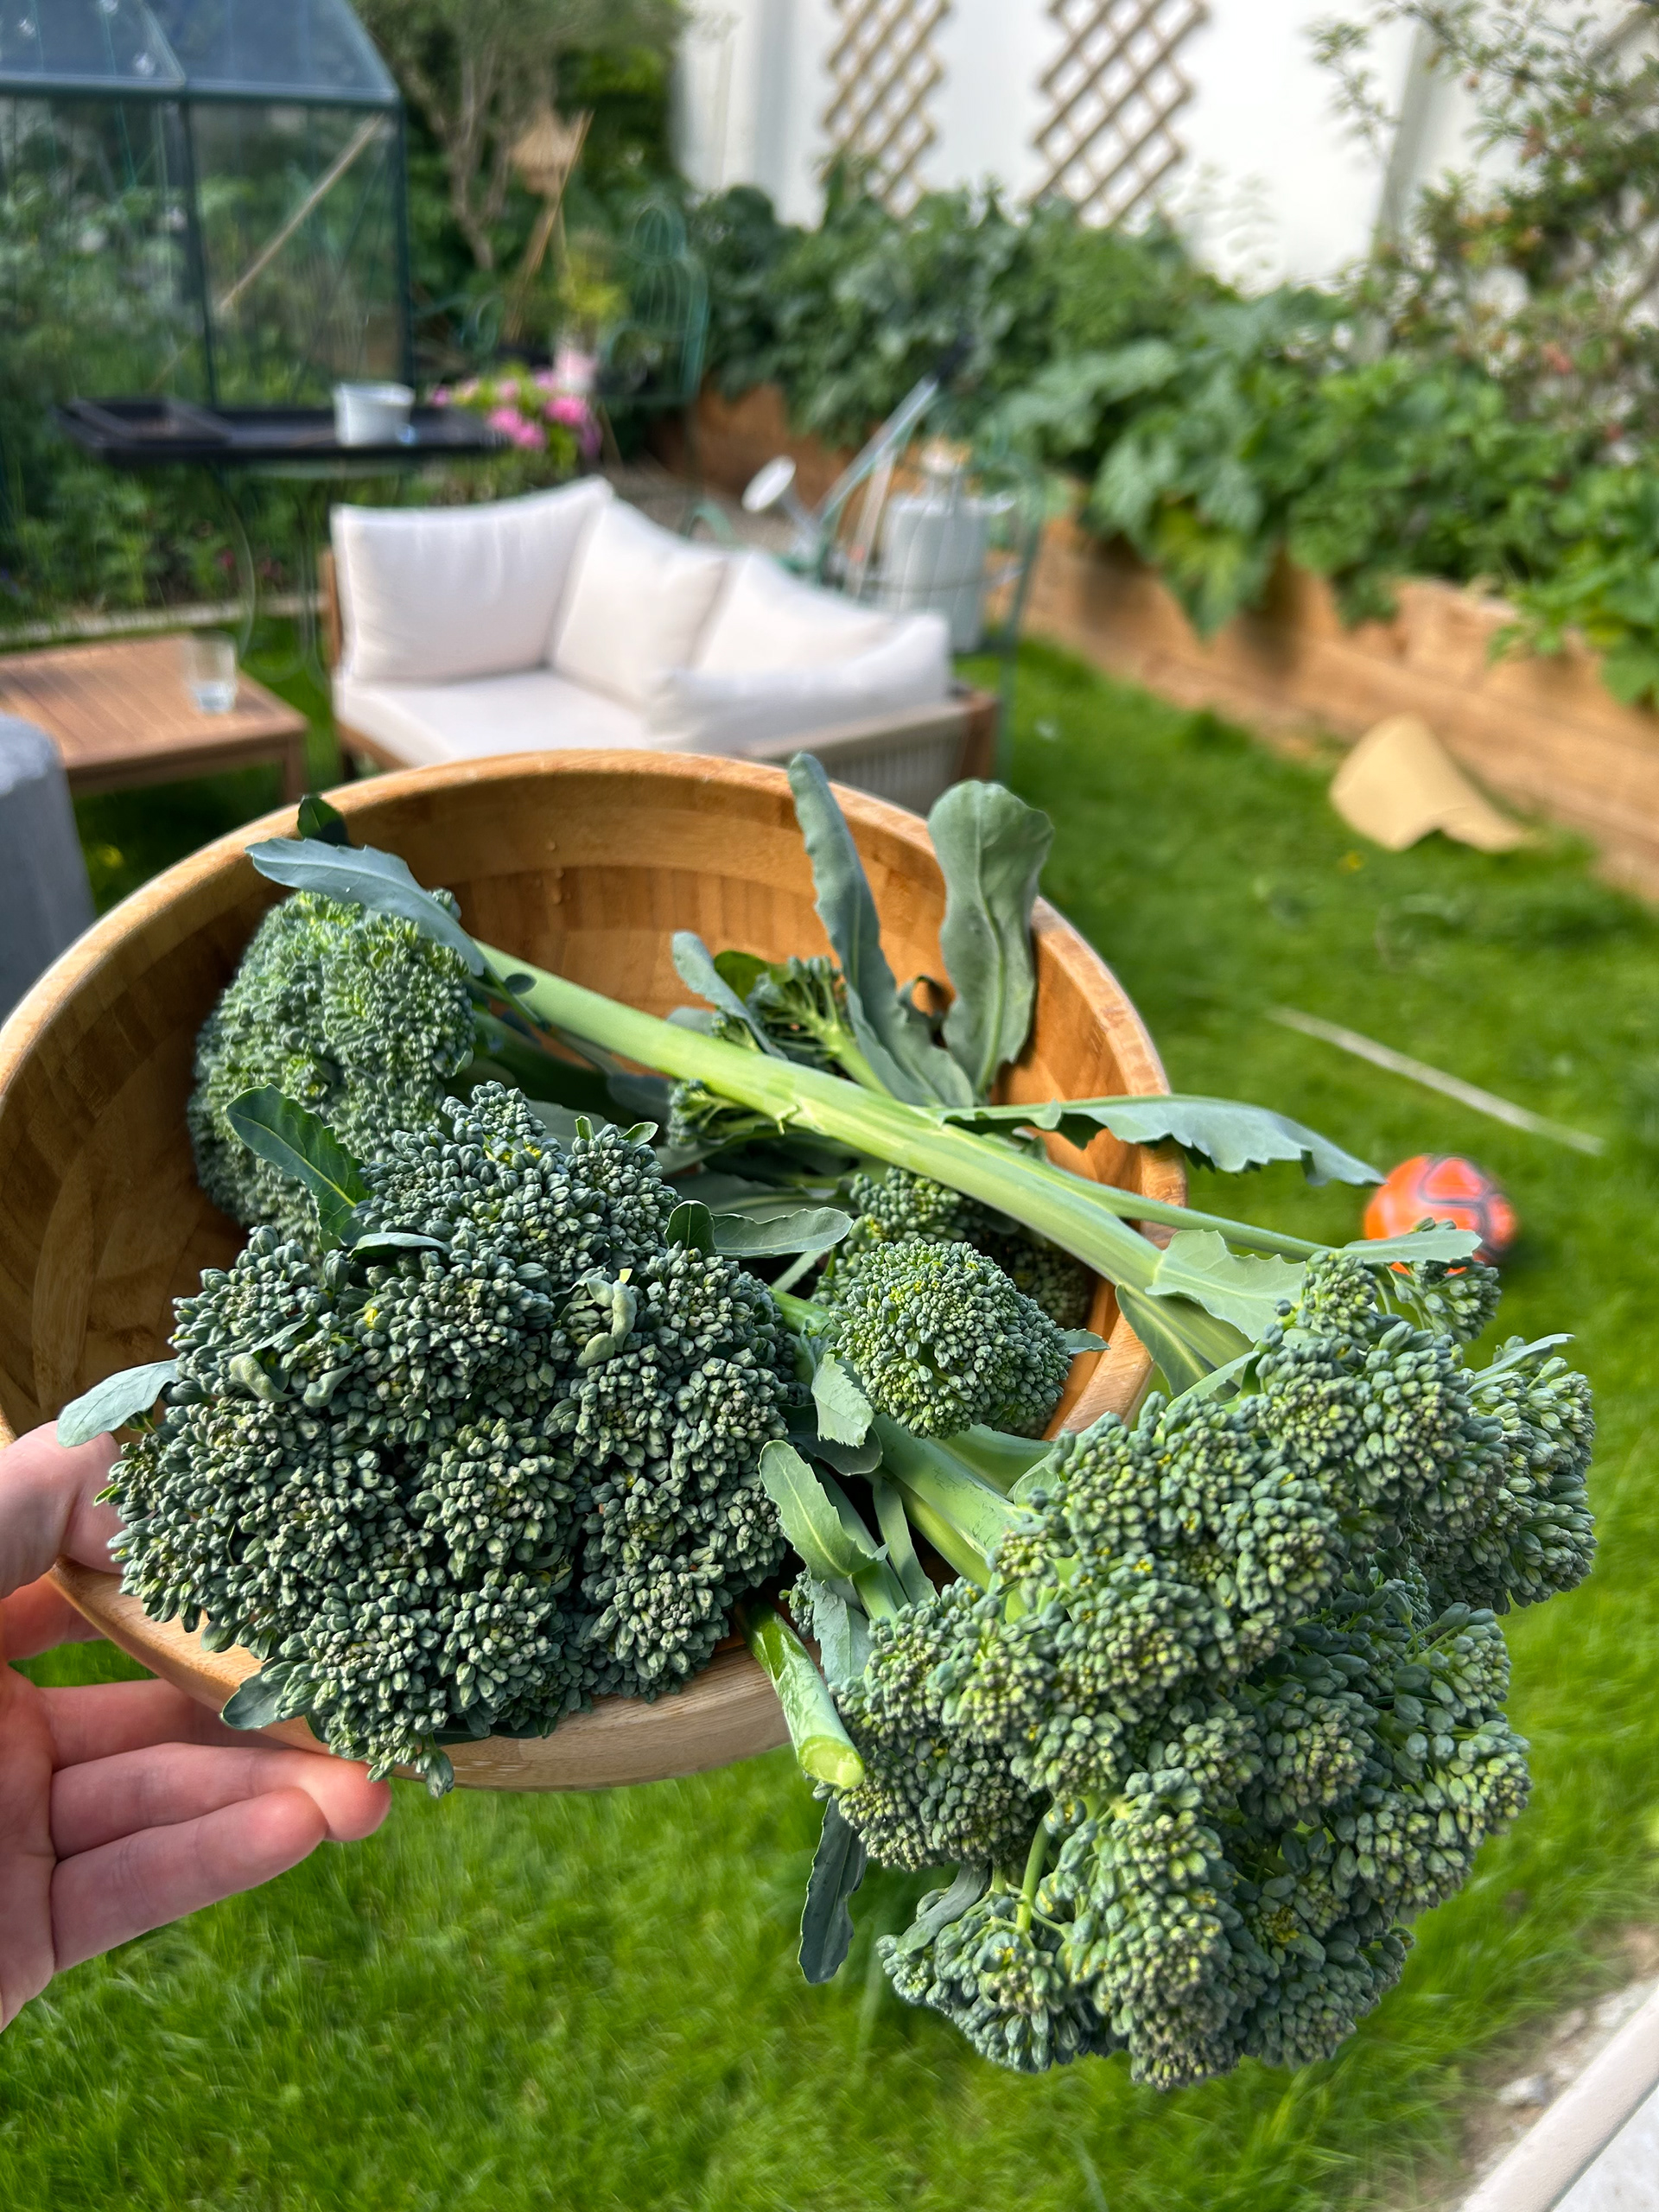
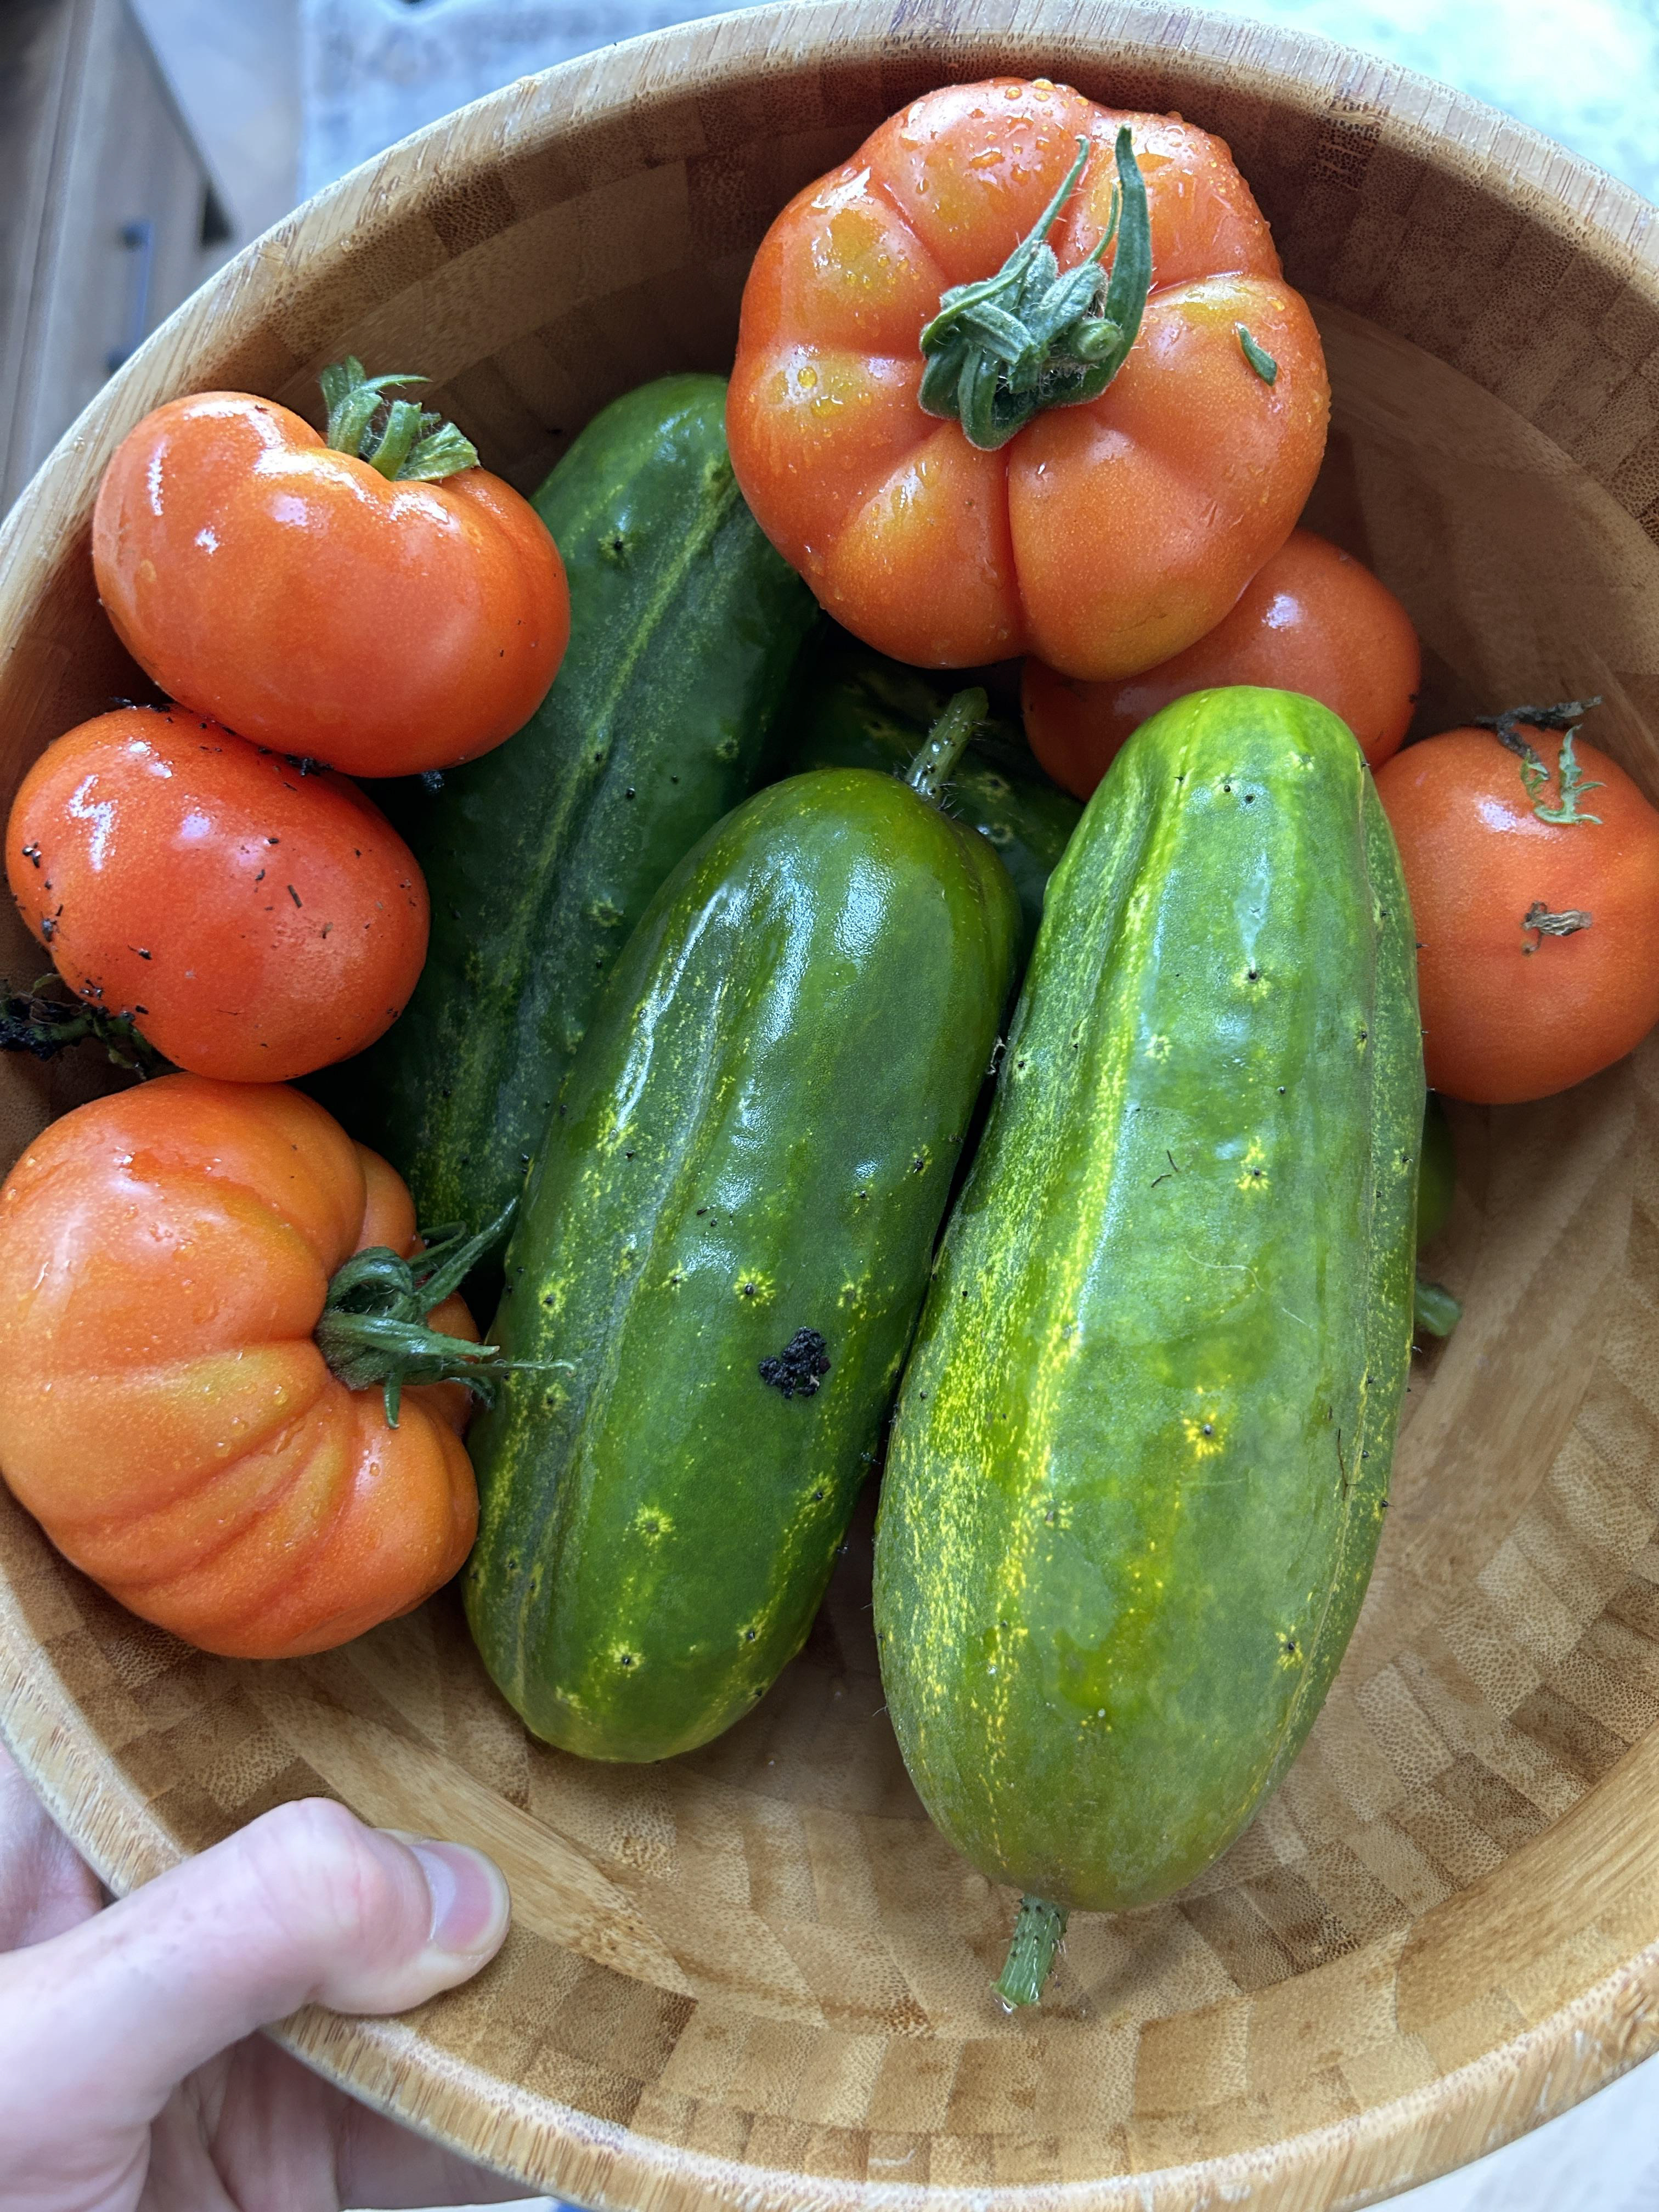
Progress was incremental, with a significant milestone in late 2024 when I installed a glass greenhouse. By the summer of 2025, I was harvesting kilos of tomatoes, unlimited salad, and broccoli - not too bad for a north-facing garden.
However, I was running like a madman to keep up with the chores for each variety whenever I caught a break from studying. There was no real planning. I gardened like an artist, relying on instinct rather than insight.
By the end of 2025, I couldn't afford for gardening to be my full-time gig. As AI tools continued to mature rapidly, I had an Eureka moment: reinvent the whole project as a win-win passion/ tech pursuit. I set out to build a Digital Twin Greenhouse project - the exact kind of system commercial operations spend thousands of euros on, rebuilt using open-source tools.
And so, fresh out of my studies, I drafted three primary goals to transition from a hobby to an engineering venture:
1. Maximise yield and minimise maintenance (The Operational goal).
2. Go from incremental to 10x learnings (The Research goal).
3. Deploy a 2026 tech stack (The Product goal - a win-win for returning to the tech sector).
2. Go from incremental to 10x learnings (The Research goal).
3. Deploy a 2026 tech stack (The Product goal - a win-win for returning to the tech sector).
2025
East Wall Bays in background (2025)
2025
Building The Digital Twin
January '26 — The Data Foundation
I used Gemini to build a comprehensive Knowledge Base for seeds and equipment inventory. There was manual input on my side, but Gemini was great at generating 20+ columns per variety: sowing calendar, pest issues, companion plants, care requirements, pollination needs, equipment, greenhouse prep etc.
Then, something clicked - Gemini naturally clustered everything around my first objective (1), with varieties grouped in about 8 clusters. Tomatoes, aubergines and peppers belong in the greenhouse (I knew that) - with varieties recommended for open pollination as I was 'instructed' to put mesh to prevent pests. Brassicas need a fruit cage outdoors because cabbage whites are relentless. It’s simple logic, but having an AI surface these relational insights saved me an entire season of trial and error.
At this stage, the main limitation was maintaining the static Knowledge Base current, which was time-consuming. More importantly, the LLM’s answers lacked physical context - they weren't grounded in my actual garden layout or local microclimate.
The Tipping Point: I sketched the exact dimensions and orientation of the greenhouse and gave the AI a spatial coordinates system to work from. My ambition was for the AI to eventually see the garden natively. I came up with this idea inspired by the cutting-edge real-world modelling happening at AMI Labs (Yann LeCun). To execute this, I abandoned static files and switched to Claude Code and Google Antigravity as my primary engineering environments. This gave the project the scalable, autonomous platform I desperately needed, since time was running out (jan-mar are big seasons for sowing).
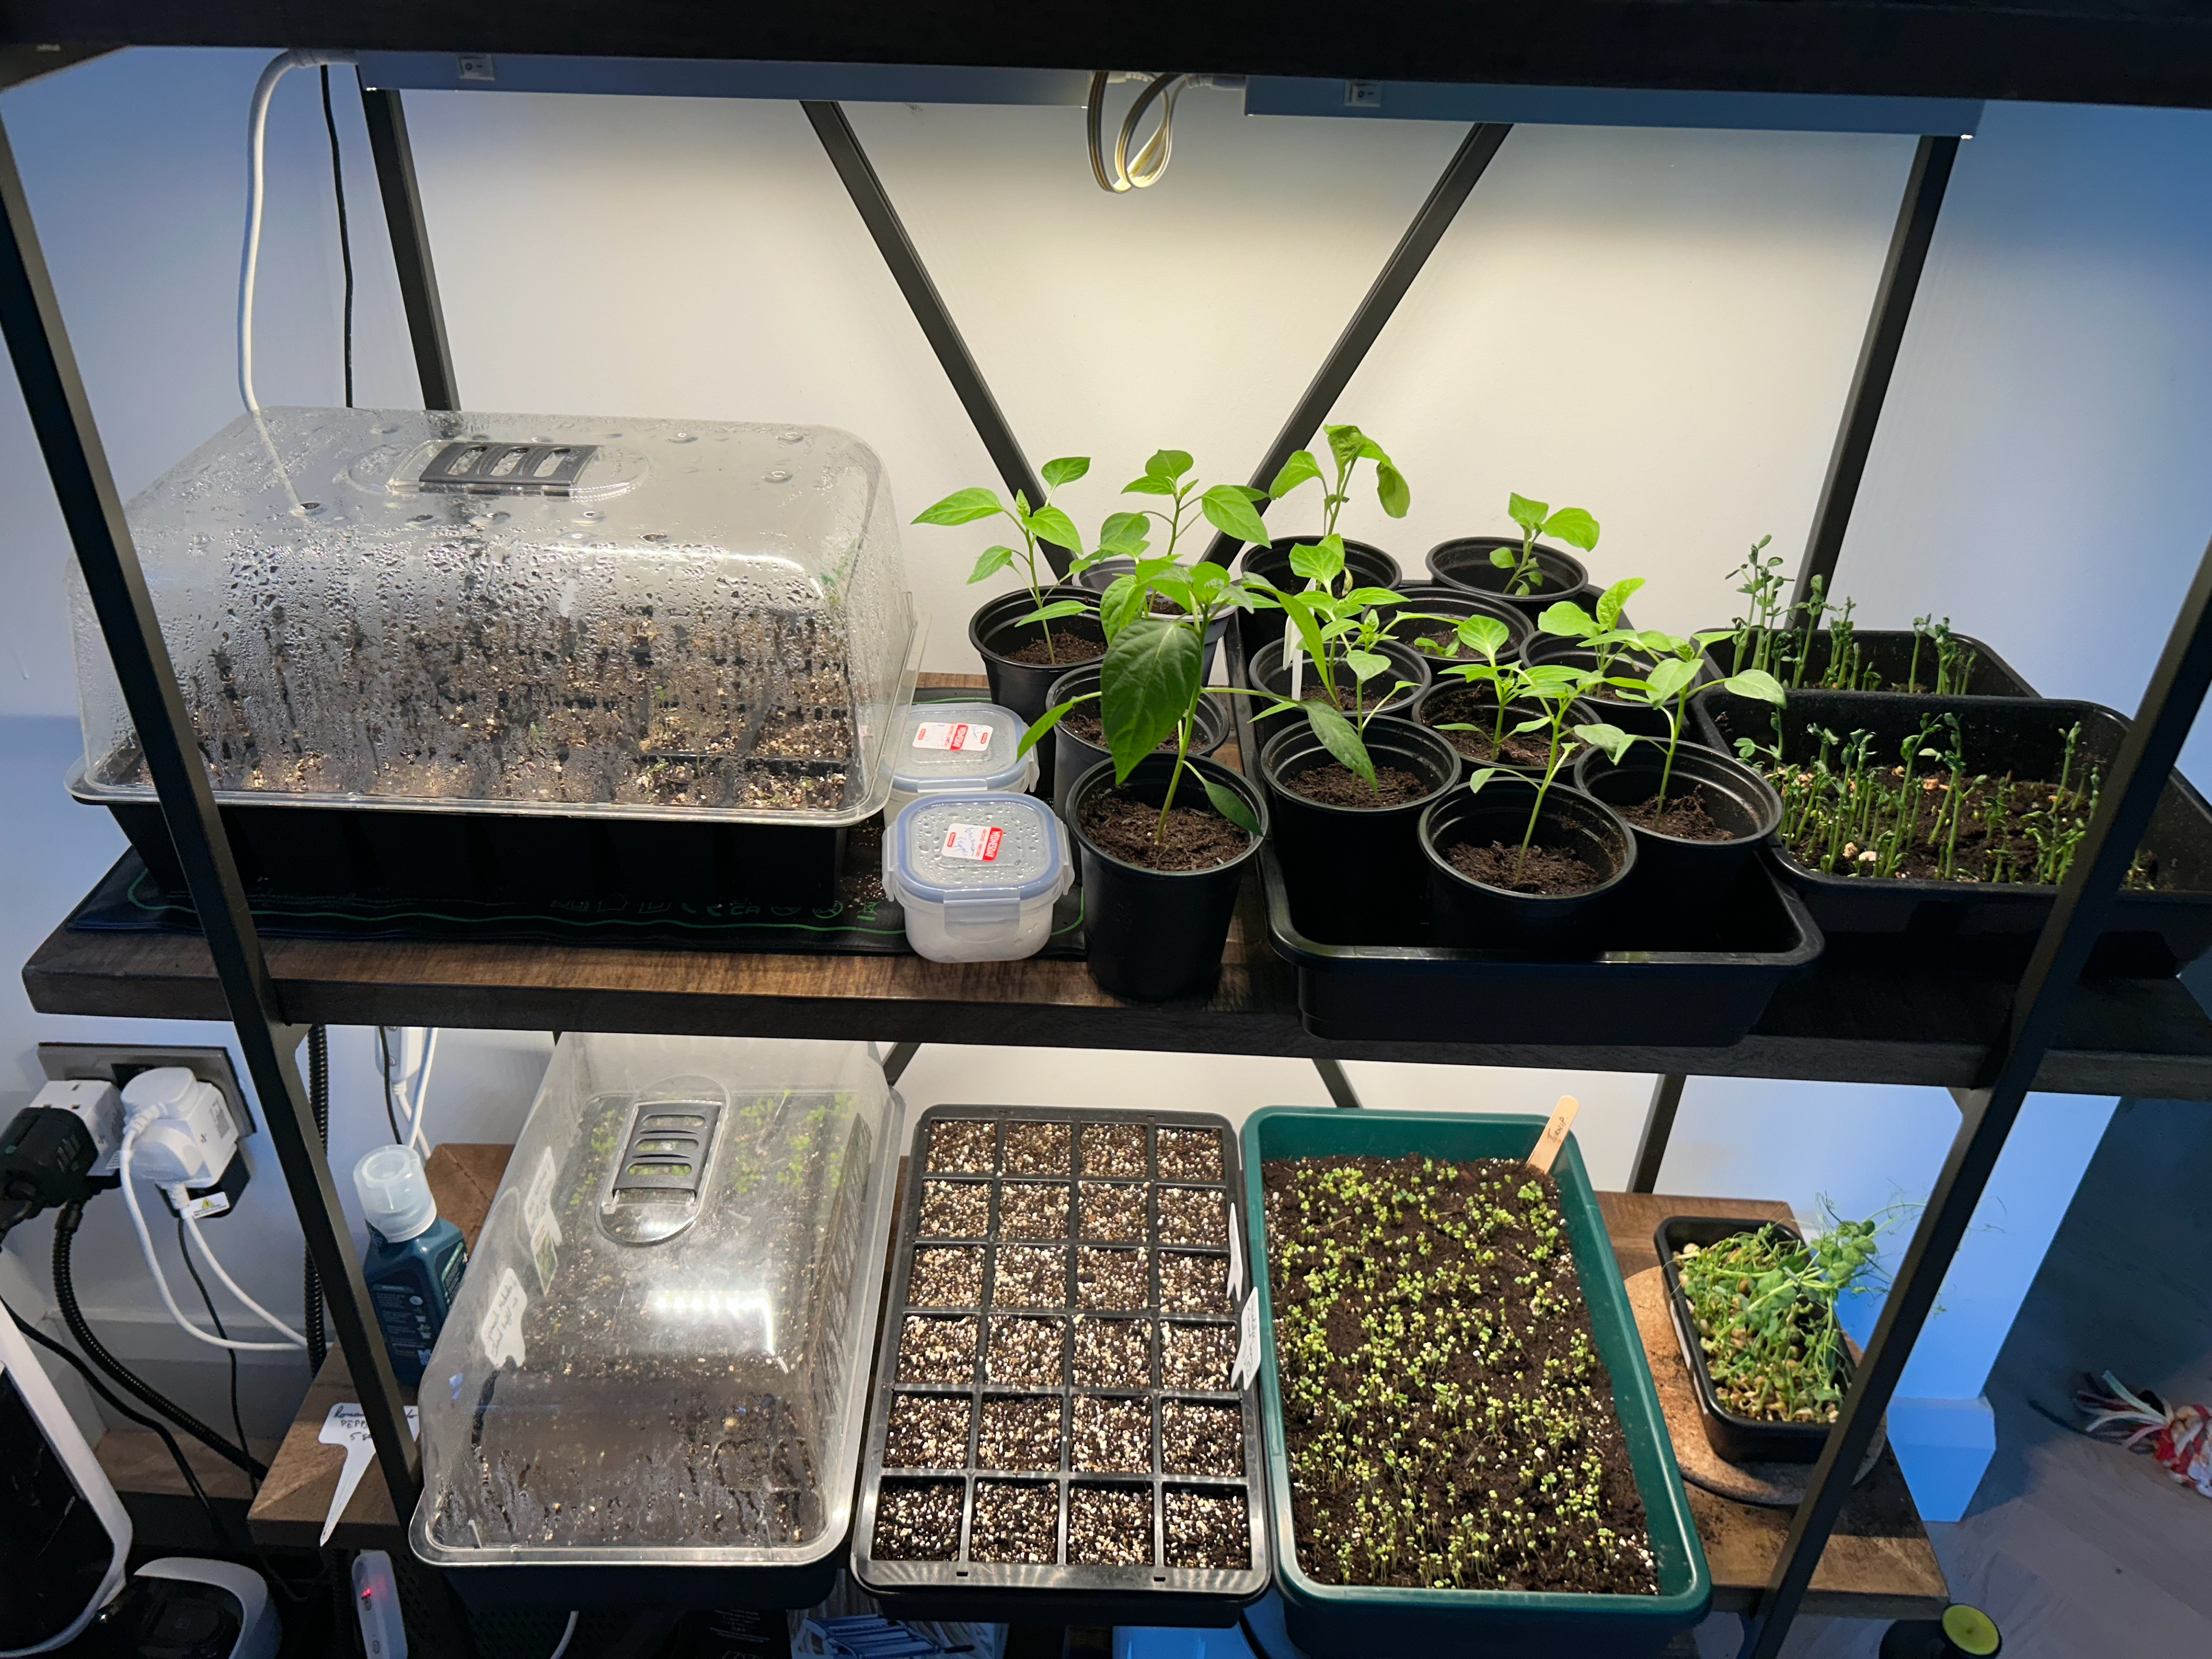
Seedlings in January - AI aware of the number of seeds, germination rate according to seed pack, and target number of plants for the growing space.
The Greenhouse: What's Growing in 2026
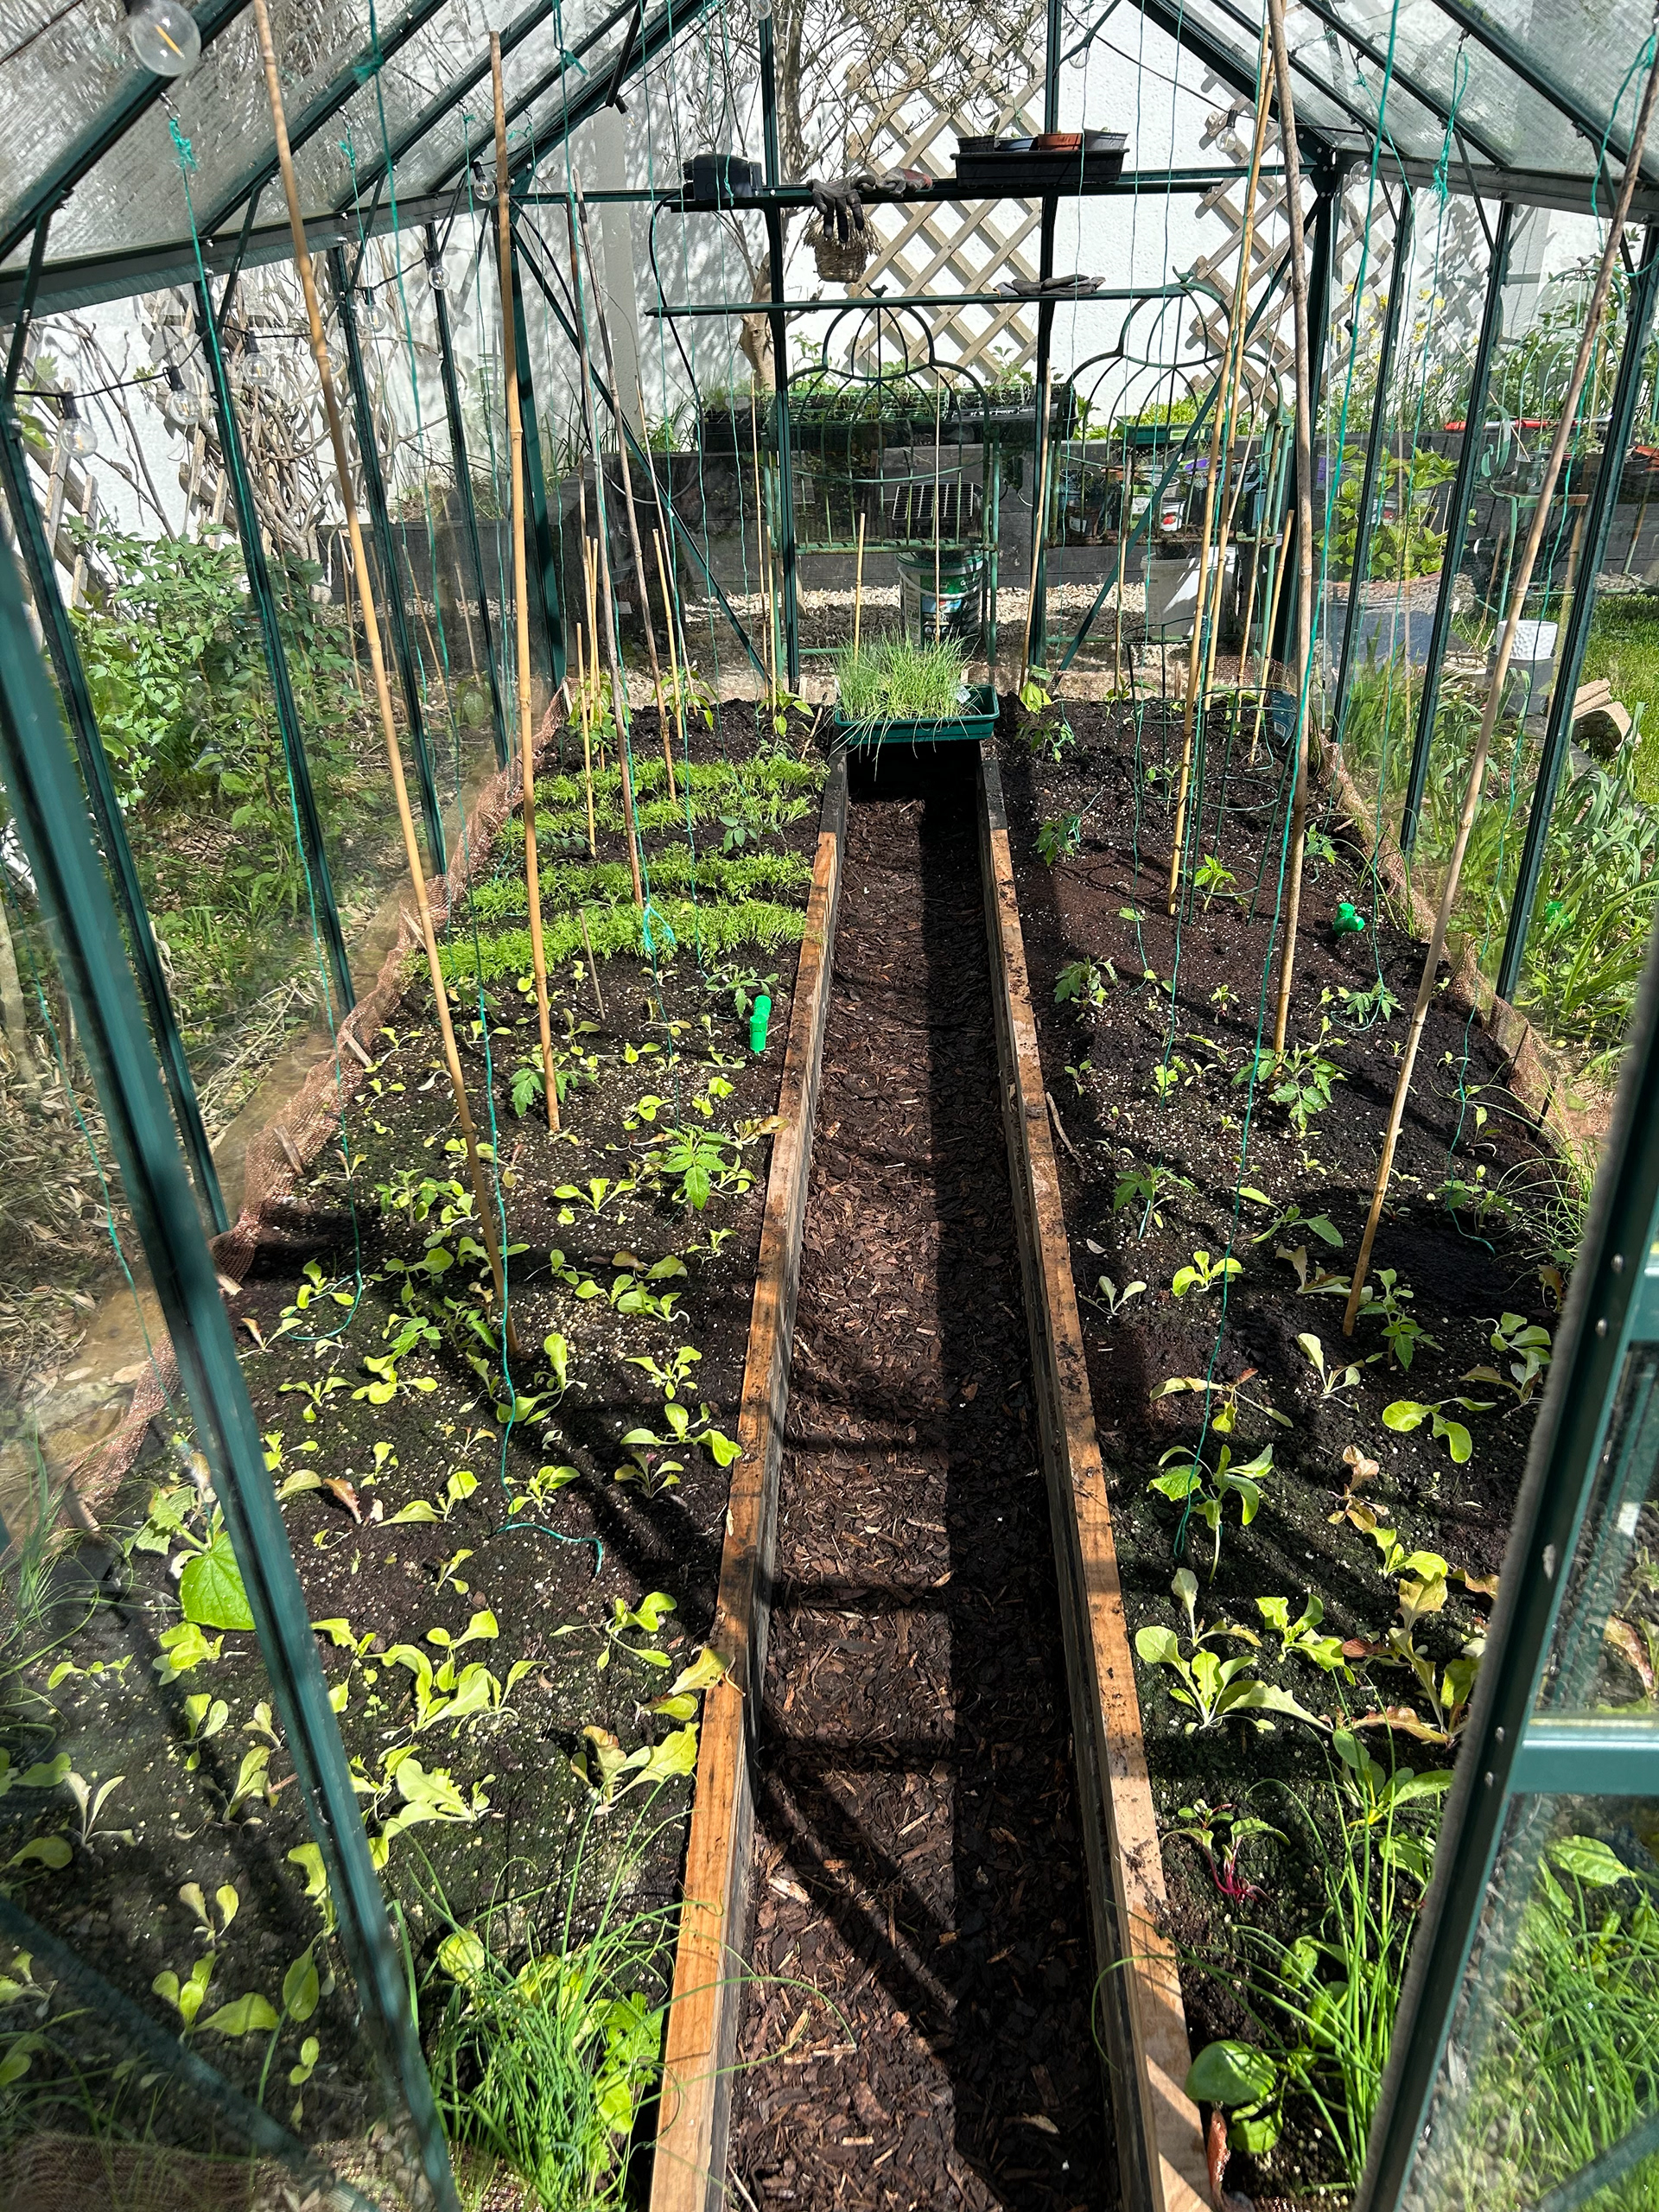
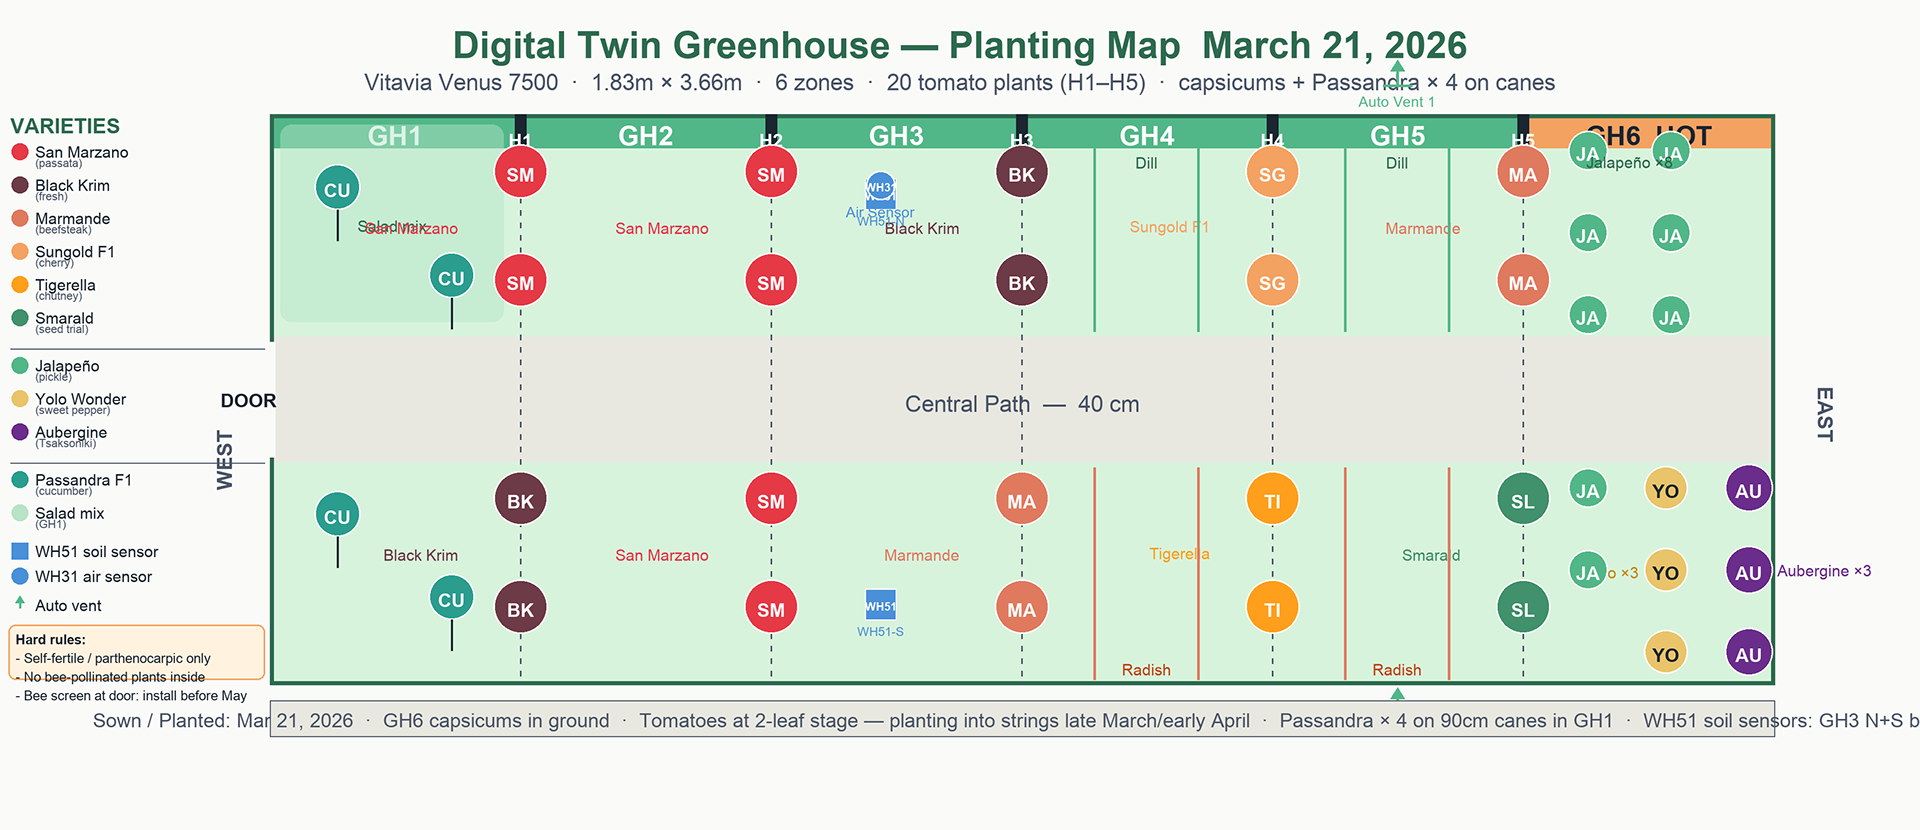
It's a good time to pause so you can actually visualise the space. As you can see in the cover photo, the Vitavia Venus 7500 is approx. 8m², split into six distinct zones.
- GH1 (Entrance): Salad, spinach, and Passandra cucumbers (grown on vertical strings).
- GH2–GH5: Five tomato varieties (San Marzano, Black Krim, Marmande, Sungold F1, Tigerella) on single-stem cordons, requiring weekly training and deshooting.
- GH6 (The Hot Zone): 26 capsicums (pepper, jalapeño) and aubergines packed tight against the east wall where thermal mass accumulates heat. Ventilator and temperature/ humidity readings are located here (and a camera running yolov8 in the future)
Crucially, the AI is aware of the spatial coordinates of every single plant (e.g., `GH1S` = Greenhouse Zone 1 South). It might sound like overkill, but it allows for granular A/B testing on plant spacing and removes entirely the need for physical labels. My system knows what is planted where. Also easy for me to query any issues with the plant in GH5S :).
Outdoors, I manage another 8–9m² across seven east-wall bays containing climbing beans, kale, kohlrabi, squash, beetroot, leeks, and fruit trees. Most soil and plant feeding are organic.
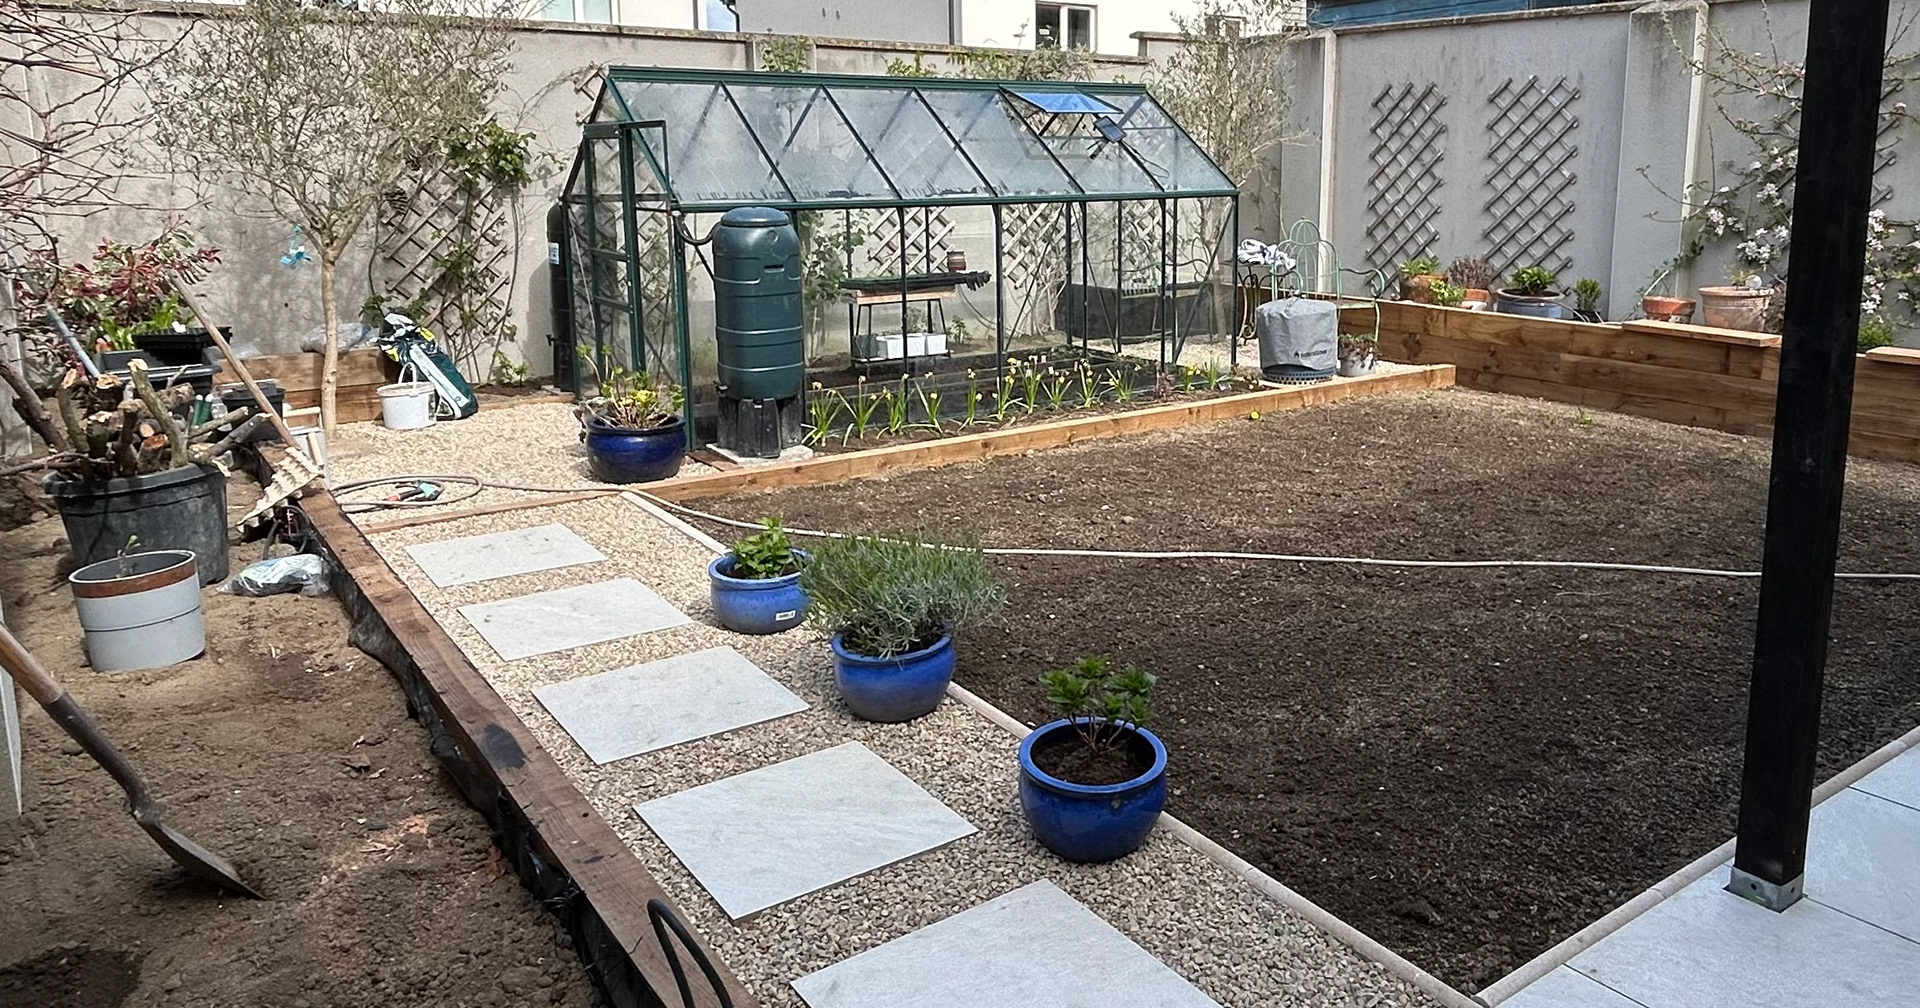
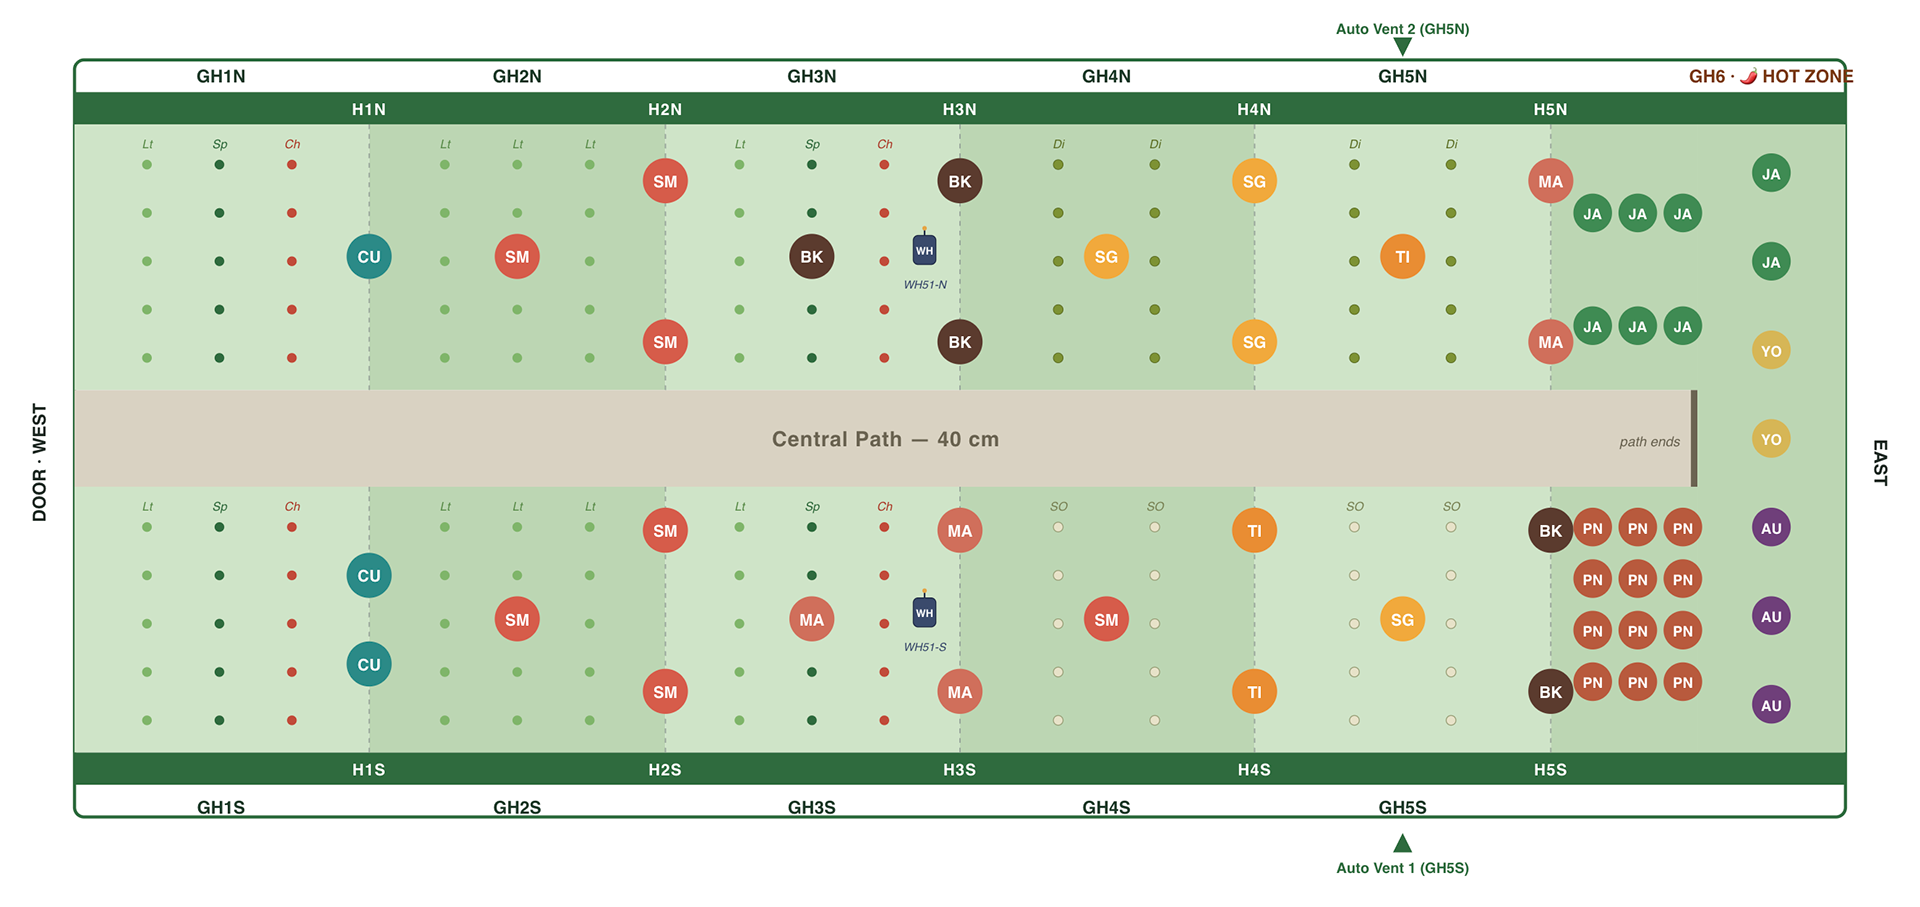
Image generated as of April 22nd, with Greenhouse crop mapping. GH6 representation needs more work. Coordinates help AI to understand crop density and advise on ventilation location.
The Technical Stack
The Ecowitt devices come with an intuitive app but not suited for the scale of this experiment. Hence a lot of customisation is done to extract the data required by this experiment. To state up front that data is processed locally.
Streamlit dashboard
The Physical Layer
The network is built arround an Ecowitt GW3000 hub. It receives 868MHz radio frequency (RF) telemetry from WH31 Greenhouse air sensor (temperature/humidity at 1.2m) and 2xWH51 volumetric soil moisture sensors mapped precisely to the north and south beds. An AC1100 smart plug controls the circulation fan natively within the RF ecosystem. And and WFC01 will trigger irrigation based on some complex calculation (time based irrigation is inefficient).
Data is exported through Ecowitt API using a poller and written to an InfluxDB timeseries database; Streamlit and Grafana display all the relevant data (including Weather forecast, Harvest log, current status, Finance/ Purchases/ RAG for questions etc.). Alerts and other workflows through n8n trigger notifications via Pushover. This basic infrastructure allows for more precise calculations and thresholds for triggering actions like ventilation or irrigation.
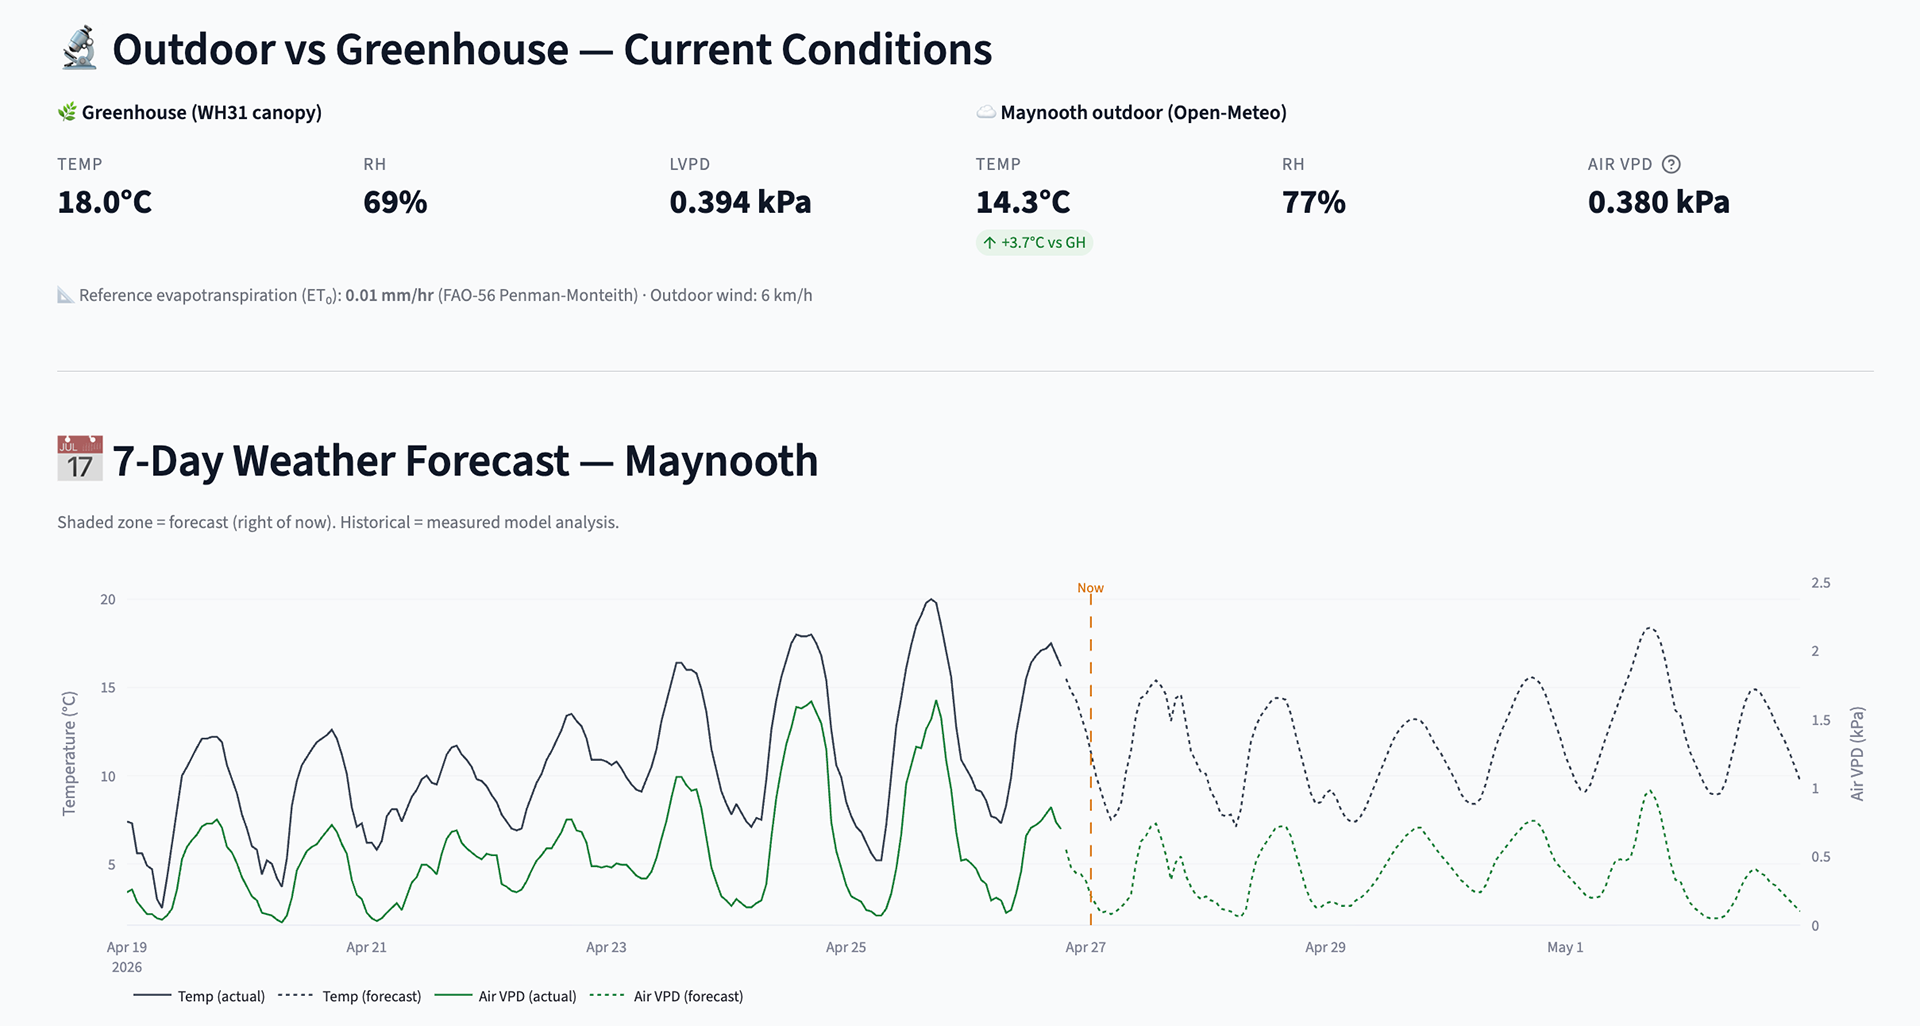
Integrating the Weather (Historic, Forecast)
This project is inherently a localised weather experiment. A greenhouse’s thermal envelope is tightly connected to external weather conditions. To model this, same local Python poller constantly queries Open-Meteo API alongside the physical sensors.
It ingests hourly resolution data for 53.38°N, 6.59°W: air temperature, relative humidity, wind speed, precipitation, reference evapotranspiration (ET₀, FAO-56 Penman-Monteith), and outdoor Vapour Pressure Deficit (VPD).
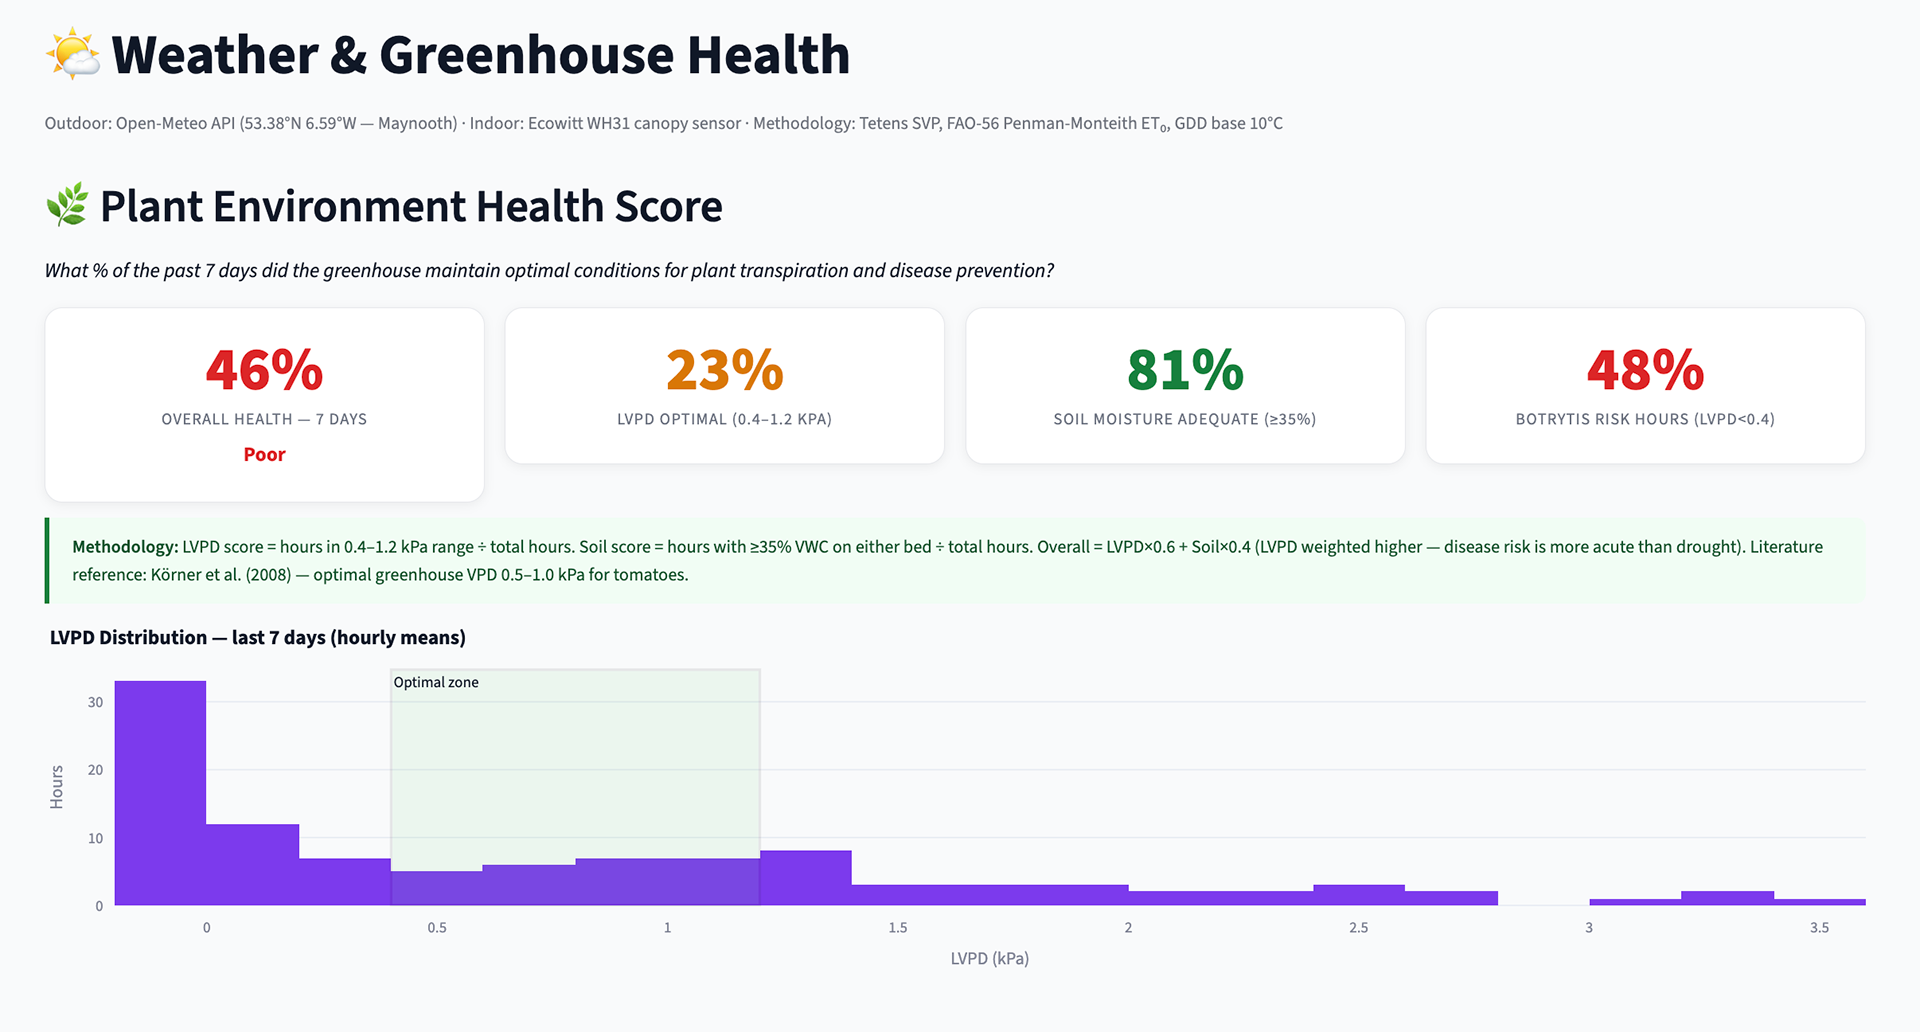
Crucially, external weather APIs like Open-Meteo aren't inherently useful for a greenhouse, on their own. You have to contextualise that data against the actual microclimate inside the glass. We shouldn't just care about the duration of a growing season; we should consider the quality of those days. In precision agriculture, this means tracking the Daily Light Integral (DLI) - the cumulative 'dose' of solar radiation a crop receives over 24 hours - to model its Radiation Use Efficiency (RUE), which measures how effectively the plant converts that light into physical harvest.
To reiterate, my ultimate goal is to generate a dataset that directly informs Irish home growers. Coming back to the duration of the season, a core metric here is the Length of Growing Period (LGP) - the number of days conditions support active crop growth (roughly 200 days outdoors in Ireland). But a long 200-day season means very little if 60 of those days are have cloud cover, polluting the overall DLI. By correlating cumulative radiation and weather data with actual harvest weights, we can start to quantify how much a greenhouse structure extends that LGP and mitigates those overcast baseline conditions. That correlation is one of the key questions the 2026 dataset is designed to answer.
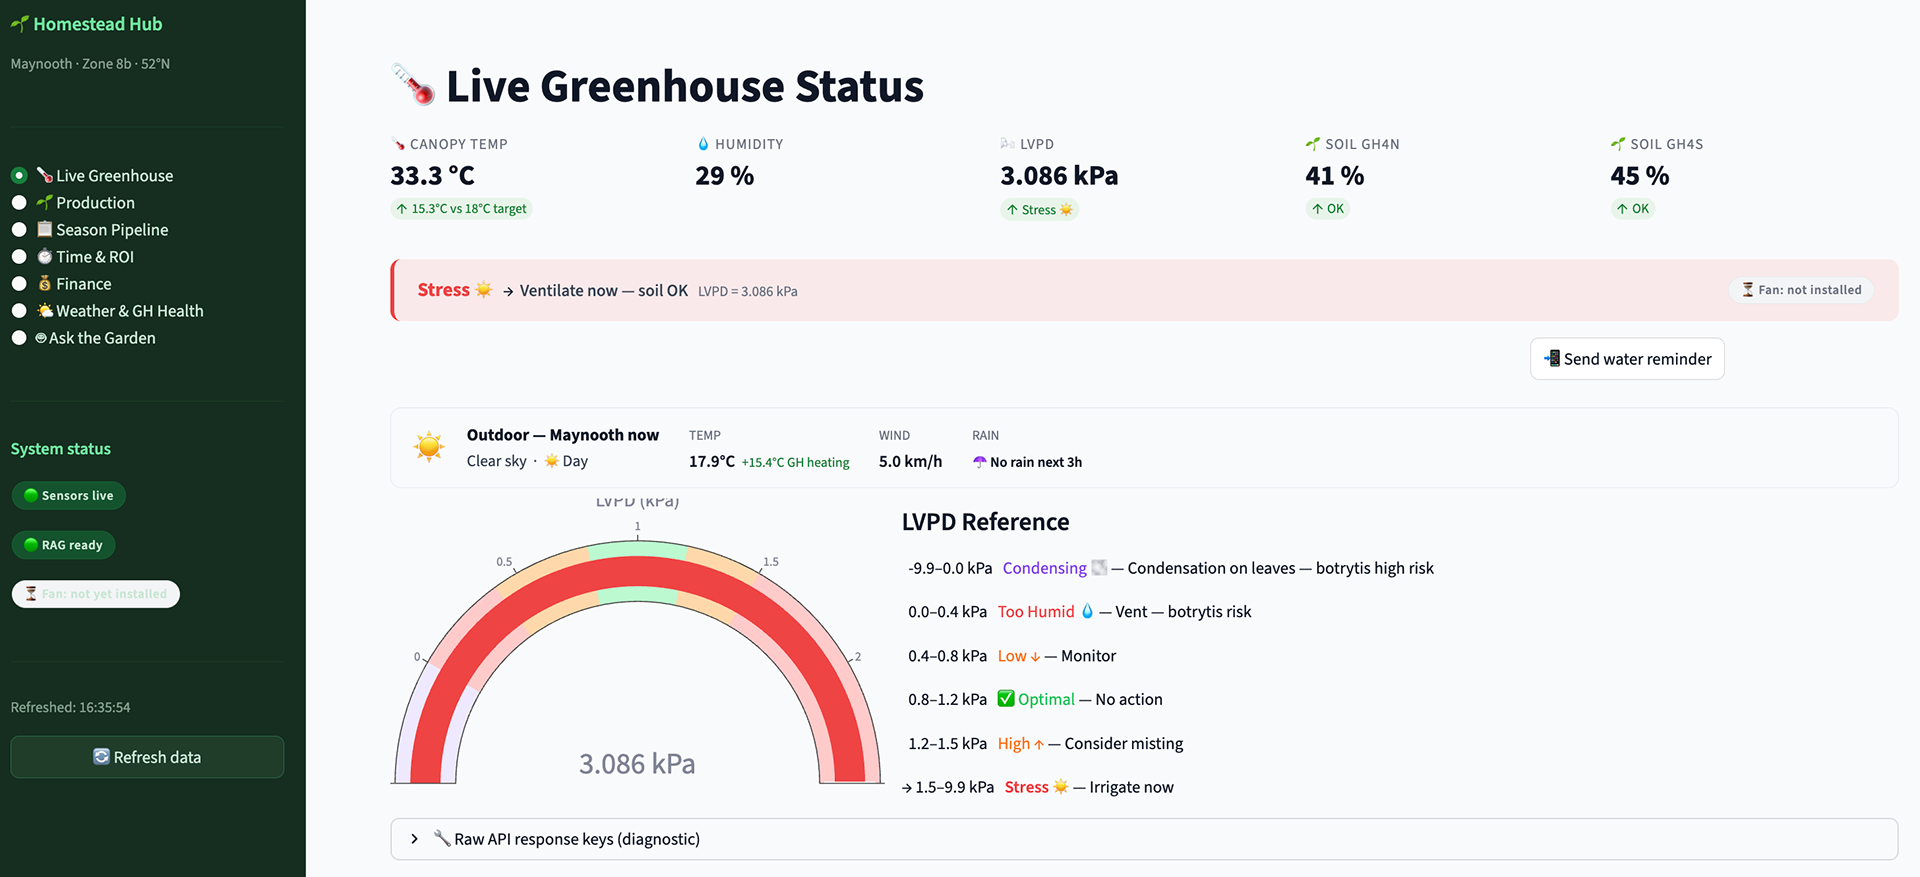
VPD: The Metric That Changes Everything
If you take nothing else away from this article, remember Leaf VPD (Vapour Pressure Deficit). It measures the atmospheric demand for water: how hard a plant is working to transpire.
- < 0.4 kPa (Too Low): High humidity. Transpiration stalls, and Botrytis cinerea (grey mould) spores activate within hours in the damp Irish climate. Over time, it destroys the plant.
- > 1.5 kPa (Too High): The atmosphere is too dry. The plant slams its stomata shut to prevent fatal water loss, halting photosynthesis entirely.
Measuring just ambient humidity misses both failure modes. Using an automated script, my local InfluxDB calculates real-time Leaf VPD (applying a 2°C leaf-offset correction). Data showed that standard Relative Humidity (RH) thresholds completely missed critical risk hours during cool-down (19:00–21:00) when airborne fungal risk explodes. Now, automated Grafana alerts ping my phone via Pushover if conditions skew towards Botrytis, Heat Stress, or Drought.
During Week May 4th I will implement the following automation: If LVPD drops below 0.4 kPa, the hub automatically fires the smart plug where a ventilator is connected, initiating air circulation to natively shift the VPD by 0.05–0.10 kPa - a closed-loop, automated system requiring zero cloud latency. Irrigation will follow.
ML/ AI and further research
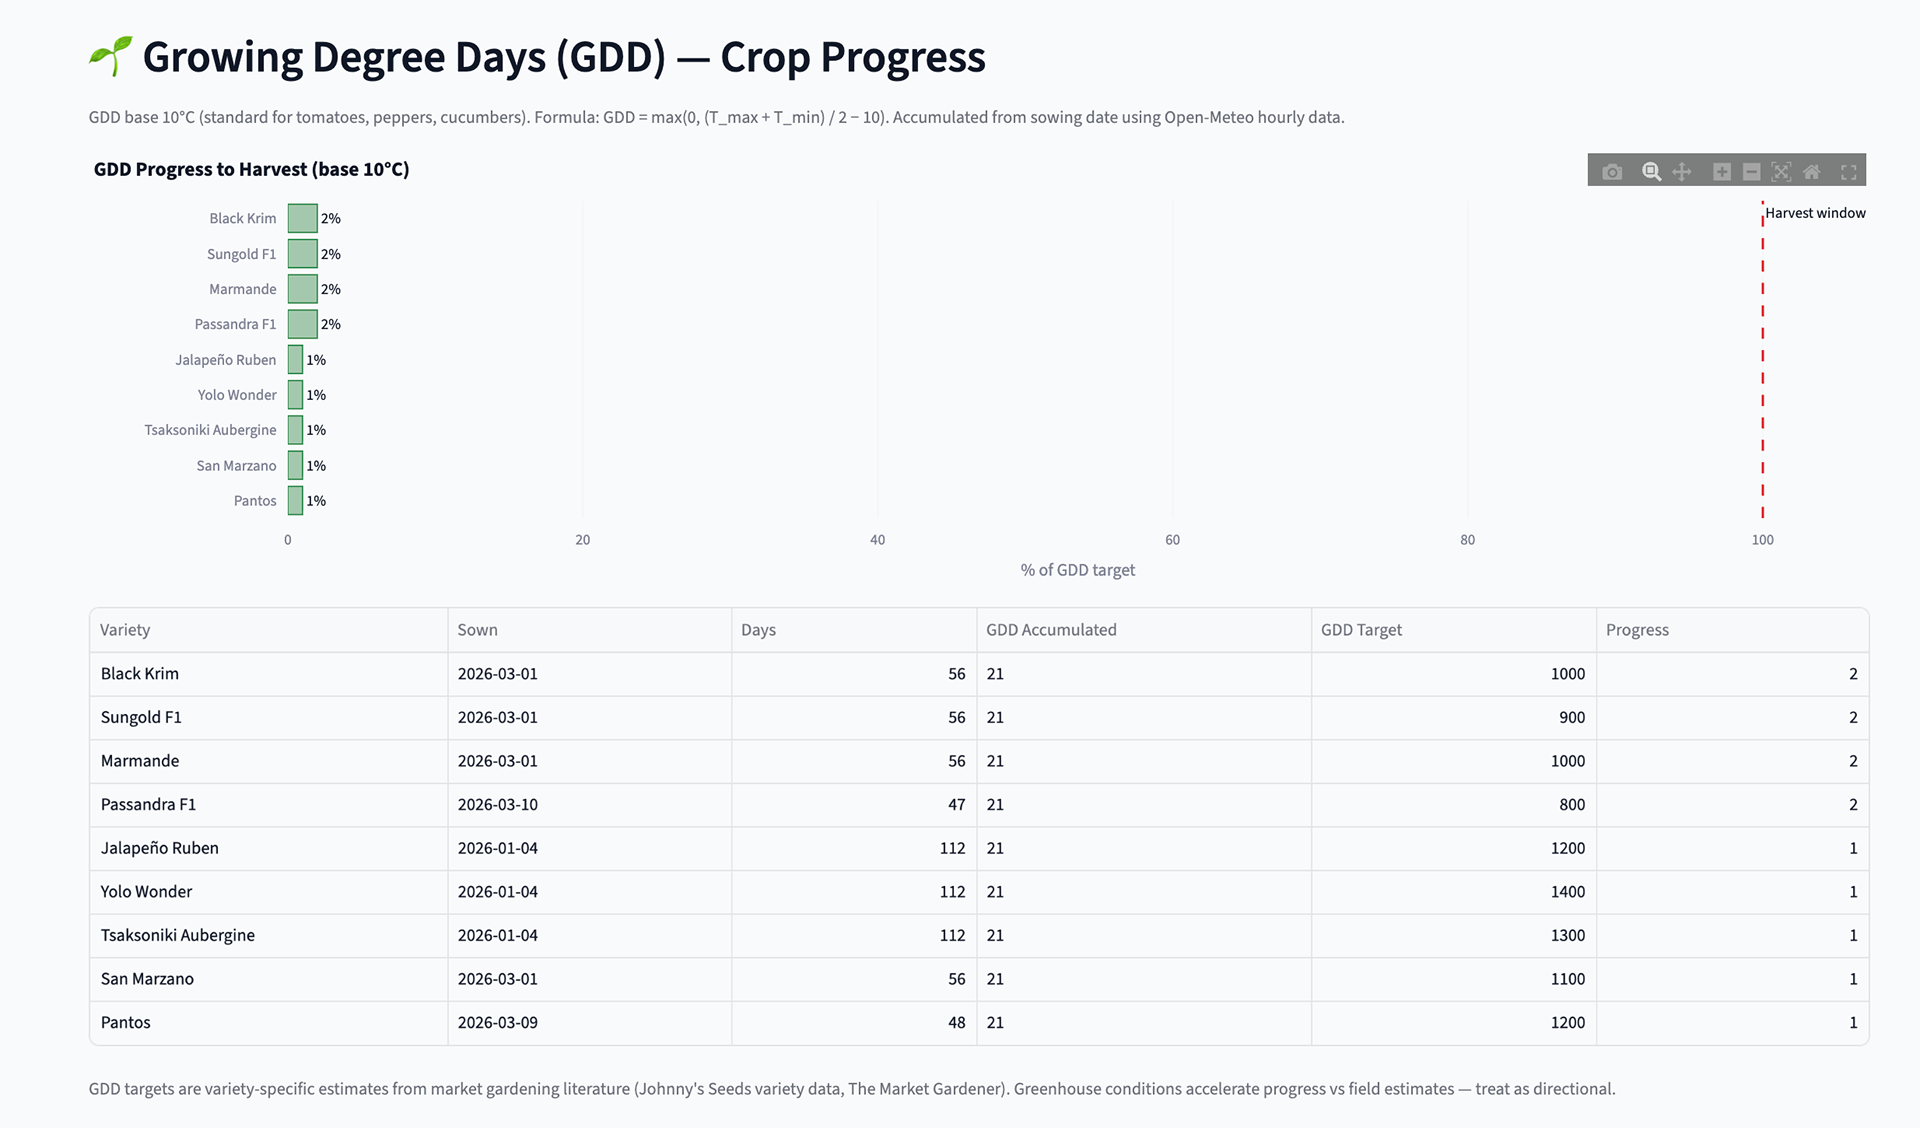
The culmination of this architecture is turning observation into prediction. Plants don't experience the calendar; they experience thermal accumulation, measured in Growing Degree Days (GDD).
# The fundamental thermodynamic constraint on crop growth
GDD_daily = max(0, (T_max + T_min) / 2 - 10°C)
The system dynamically predicts the harvest window. Since Sungold F1 needs approx. 900 GDD to ripen, Open-Meteo's hourly forecasts combined with local sensor accumulation allow to say, "The crop is at 340 GDD, approximately 5 weeks from harvest," rather than guessing based on seed packet averages.
This distinction solves the ultimate constraint of the Irish climate: we have a deceptively long Length of Growing Period (LGP) on the calendar, but incredibly weak thermal intensity. While a tomato plant might survive an Irish summer outdoors, it will unreliably accumulate the 900 GDD required to ripen. Large-fruited varieties (like San Marzano at ~1100 GDD) genuinely can't make it outdoors. The greenhouse acts as a GDD multiplier, allowing the ML model to quantify we can compress the required thermal energy into our unheated LGP window.
Feature Engineering: The Math Behind the Sensors
The true power of this project lies in feature engineering - transforming raw sensor data into predictive variables that I can use to run observations/ forecasts at the end of '26. I'm not just recording temperatures, but calculating the mathematical deltas that define greenhouse physics:
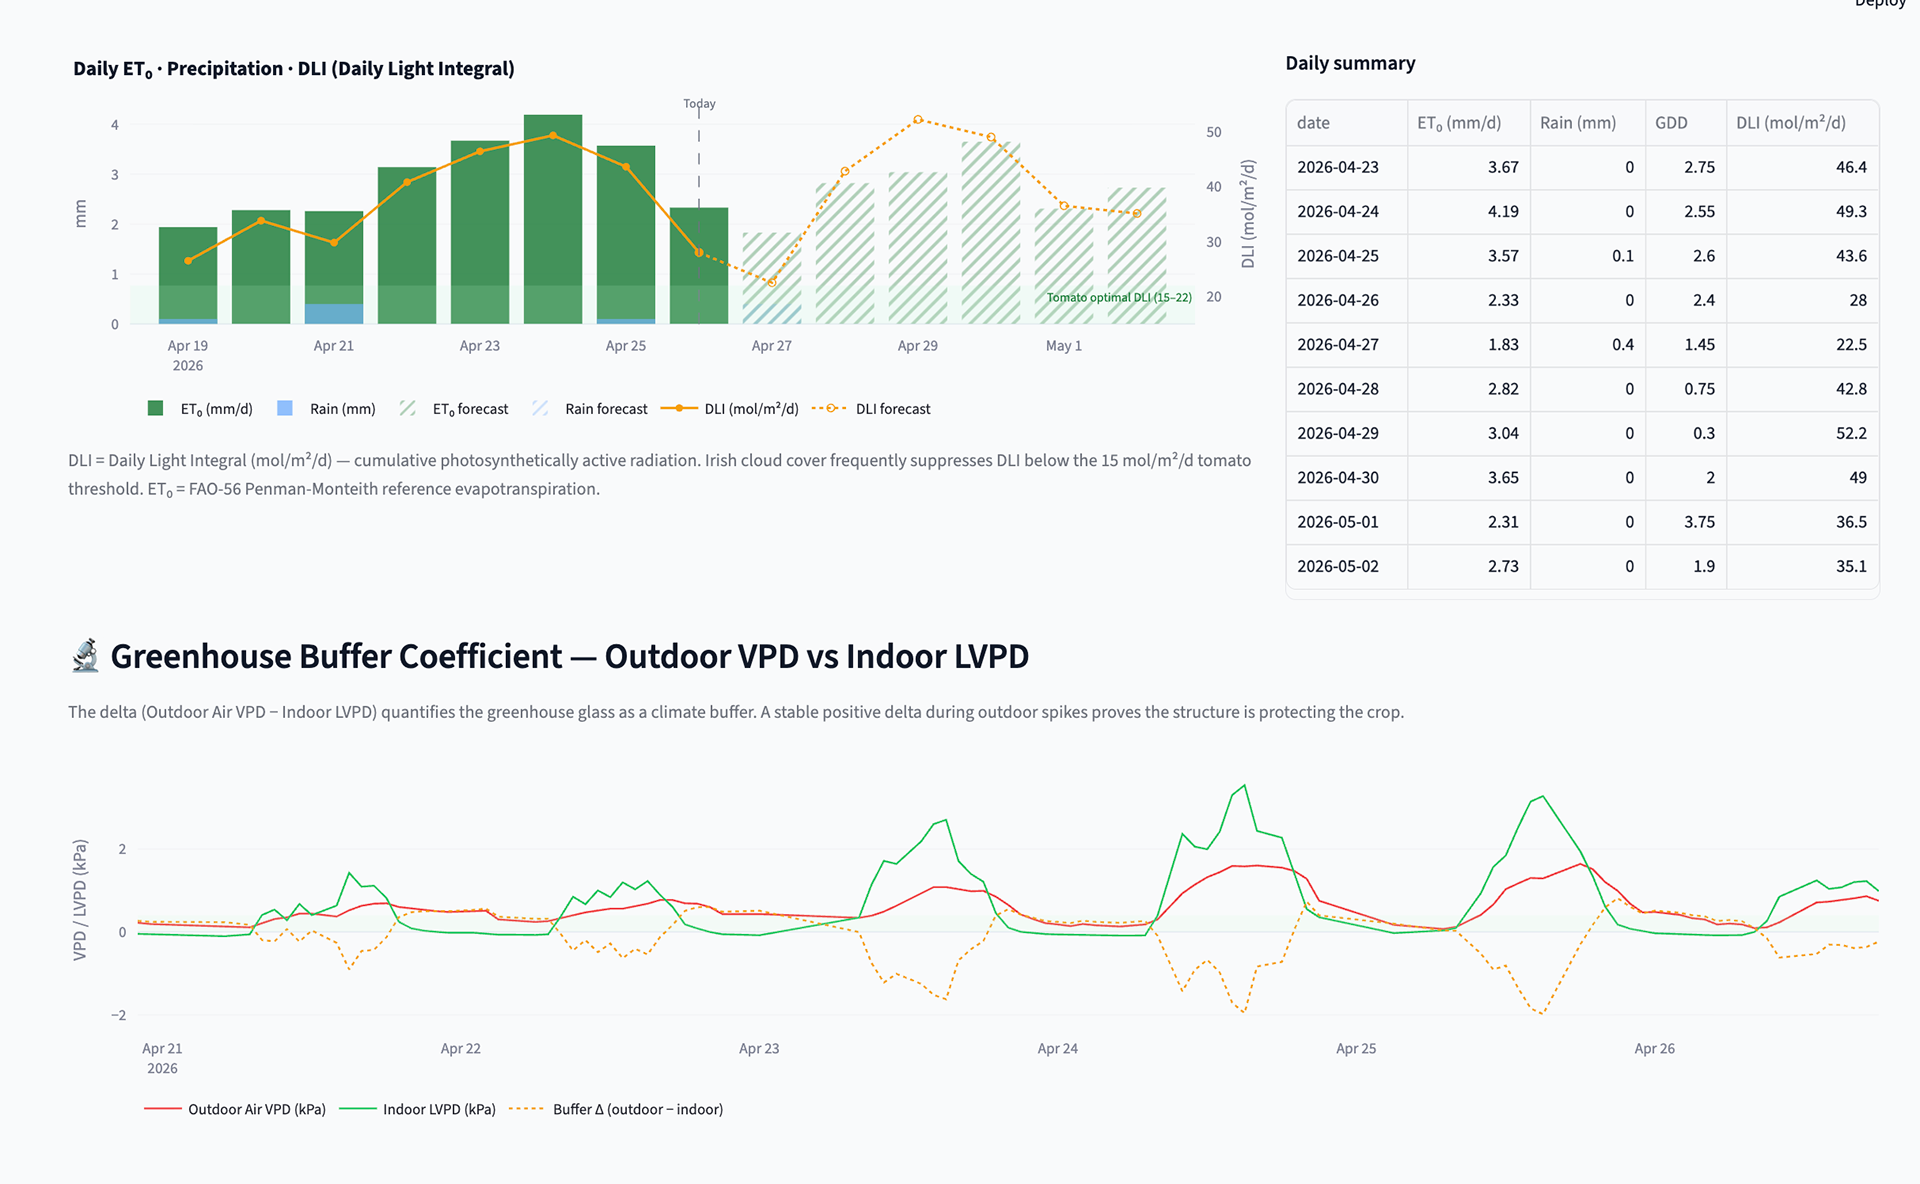
1. The VPD Delta (Outdoor VPD minus Indoor LVPD): By measuring both the macro-forecast and the microclimate, the model calculates the "buffer coefficient" of the glass structure. If Open-Meteo forecasts a harsh, high-stress outdoor VPD tomorrow, the ML model uses historical deltas to predict exactly how the indoor LVPD will react, proactively knowing how much fan circulation is required to maintain homeostasis (stable balanced systems, despite external factors).
2. ET₀ & Crop Coefficient (Kc): Open-Meteo calculates baseline ET₀ (Reference Evapotranspiration) using the industry-standard FAO-56 Penman-Monteith method. However, this baseline models a generic grass field. To calculate the actual daily transpiration of tomatoes, the system must multiply ET₀ by a mathematical Crop Coefficient (Kc). Because different growth stages alter transpiration rates, the ML pipeline uses accumulated Growing Degree Days (GDD) tracking to dynamically scale the Kc variable from 0.4 up to 1.15 as the canopy matures. This generates a hyper-accurate, plant-specific daily water budget.
The 2026 dataset directly can support a research thesis on its own: Can we accurately model complex, non-linear microclimate envelopes to predict yield, optimise resource use, and inform the decarbonisation of local food production? Resource Efficiency, Yield Prediction Model (initially a Random Forest Regressor) will be key to benchmark harvested kilograms against the water and energy consumed to grow them.
Ultimately, predicting those metrics is partial solving the problem unless they drive action. If the telemetry forecasts a rapid soil evaporation rate (high ET₀ against our LVPD), the model shouldn't just run an automated water pump. It should surface the need for physical agronomic interventions - like top-dressing biological beds with heavy mulch or vermiculite - to proactively lower the baseline water demand in the first place.
In conclusion, by the end of the 2026 season, I will have approx. 180 days of 5-minute resolution, chronologically continuous multivariate data: canopy temps, dual-zone soil moisture, ET₀, precipitation, and LVPD deltas, alongside labeled, weighted harvest events. The all inclusive package.
What the 2026 season is actually trying to answer
The 2026 data collection phase is strictly exploratory. To reiterate, the system is deployed to gather the baseline needed to trace the thermodynamic envelope of an unheated, 8m² glass greenhouse operating in Zone 8b Irish conditions. It is not designed to compete with commercial-scale growing operations, which operate in an entirely different context.
The questions I'm trying to answer:
- What does an unheated home greenhouse actually yield, in this climate, with this crop mix? Not seed catalogue estimates - real kilograms, measured weekly, from April through October.
- What is the effective Length of Growing Period? Outdoors in Maynooth, the LGP is roughly 200 days. Inside the glass, it's longer - the 2026 data will quantify exactly how much, and what that extension is worth in yield terms for different crop families.
- What are the microclimate conditions that actually matter? LVPD distributions, humidity risk periods, soil moisture dynamics, DLI variability - by month, against actual weather.
What does the energy and carbon footprint of this specific setup look like? The honest answer is: I'll know at the end of the season! The system draws approx. 18W continuously. At the Irish grid's current carbon intensity (approx. 350g CO₂/kWh, SEAI 2023), that's roughly 55 kg CO₂/year. Whether that figure looks good or poor depends entirely on the measured yield - which is the point.
What does the energy and carbon footprint of this specific setup look like? The honest answer is: I'll know at the end of the season! The system draws approx. 18W continuously. At the Irish grid's current carbon intensity (approx. 350g CO₂/kWh, SEAI 2023), that's roughly 55 kg CO₂/year. Whether that figure looks good or poor depends entirely on the measured yield - which is the point.
These are open questions and while the 2026 data provides the baseline, any meaningful conclusions (what's worth replicating, what conditions to optimise for, what a reasonable home grower should expect) have to wait for the Data Analysis bit.
Open Source, Next Steps
I wasn't able to find publicly available microclimate data for small-scale glass greenhouses in Ireland. Commercial operators work at a completely different scale and rightly treat operational data as proprietary. Research bodies are providing great resources but I haven't seen automated IoT solutions implemented in real world. That leaves a genuine gap for anyone considering a home greenhouse: what can you actually expect if you maximise all growing conditions? And how to do that in the first place?
After outsourcing the dataset at end of 2026, the ambition for 2027 is to use two seasons of data to build something more useful: a predictive model that tells a home grower, given a macro-weather forecast and their specific structure, what yield range they can reasonably expect.
Want to follow the experiment, share suggestions or discuss the data? Get in touch on LinkedIn.
Methodology, References, Calculations
Energy & Carbon Estimates (to be validated against 2026 measured data):
- Energy Draw: Sensors, hub, automated fan (running ~4h/day), and local compute average a continuous draw of ~18W.
- Annual Consumption: 18W × 24h × 365 days = approx. 157.68 kWh/year.
Irish Grid Carbon Intensity (2023 SEAI Data): approx. 350g CO₂/kWh.
Irish Grid Carbon Intensity (2023 SEAI Data): approx. 350g CO₂/kWh.
- Estimated System Emissions: 157.68 kWh × 0.350 kg CO₂ = approx. 55 kg CO₂/year.
- What this means per kilogram depends on yield. At 40 kg harvested: ~1.4 kg CO₂/kg. At 80 kg: ~0.7 kg CO₂/kg. Measuring actual yield is the primary goal of the 2026 season.
Note: domestic solar generation, if metered, would reduce the grid draw figure. This will be tracked as part of the sustainability dashboard view (Streamlit).
Sources: SEAI (2023) National Energy Balance; Teagasc (2022) Environmental Footprint of Local vs Imported Vegetables.
---
Note on Domain Expertise: This project is an independent exploration of microclimate modeling. I don't have an AgriTech background, hence please get in touch if you have any feedback.
Technical Stack: Python, InfluxDB, SQLite, Grafana, Streamlit, Docker, LlamaIndex, MiniLM-L6-v2, scikit-learn, Open-Meteo API, n8n.
Repository: github.com/danbujoreanu/GreenhouseDigitalTwin
Maynooth, Co. Kildare · Zone 8b · April 2026